From OTel to Rotel: 4x Throughput Increase in PB-Scale Tracing
This article benchmarks OpenTelemetry data planes for writing trace spans to ClickHouse. On the same 8‑core host, Rotel achieves 3.7 million spans/sec (462k spans/core/sec), a >4× improvement over the OTel Collector. Gains come from three optimizations: binary encoding of JSON columns in RowBinary, moving deserialization to a shared thread pool to avoid tokio blocking and glibc allocator lock contention, and enabling fast LZ4 compression. The test also exposes silent data loss in the OTel Collector under backpressure. For engineers scaling large telemetry pipelines.
Efficiency matters at scale: even small reductions in resource consumption can lead to significant cost savings and efficiency gains.
OTel + ClickHouse benchmark: we built a data pipeline to evaluate the performance of streaming trace data into ClickHouse.
Rotel achieves a 4x throughput improvement: we demonstrate how we boosted from 137K trace spans per core per second on the OTel Collector to 462K on Rotel, detailing several key performance optimizations.
Tools and resources: we provide the list of tools used in our benchmark at the end.
Introduction
Operating an observability platform at petabyte scale requires continuous focus on resource efficiency. Even small improvements in per-core performance or memory usage can dramatically reduce infrastructure costs.
This article is based on a talk we gave at a ClickHouse meetup in Denver. In it, we shared our work on Rotel, a high-performance OpenTelemetry data plane designed for large-scale systems.
Thanks to its high compression and cost efficiency, ClickHouse is increasingly used for large-scale OpenTelemetry workloads. In these systems, the OTel Collector is often the most expensive part of the pipeline.
Recently, ClickHouse published an article on the importance of efficiency at scale (https://clickhouse.com/blog/scaling-observability-beyond-100pb-wide-events-replacing-otel), sharing their experience running OTel on their internal LogHouse platform.
One detail caught our attention:
"OTel Collector: using over 800 CPU cores to transport 2 million logs per second."
That translates to roughly 2,500 logs per core per second. For typical log lines, an 8-core server would handle only about 10 MB/s—far below modern hardware capabilities. Meanwhile, ClickHouse can process over 12,500 OTel events per core per second, more than 5x the ingestion side. The bottleneck is clearly on the collection side, not storage. Although we cannot replicate ClickHouse's internal LogHouse platform, we thought it meaningful to benchmark modern OTel data pipelines. So we wanted to explore a core question: how do different OTel data planes perform when sending traces to ClickHouse?
大规模系统中的效率至关重要:即便是资源消耗的小幅下降,也可能带来显著的成本节约和效率提升。
OTel + ClickHouse 的基准测试:我们构建了一套数据管道,用于评估将流式追踪数据写入 ClickHouse 的性能。
Rotel 实现了 4 倍性能提升:我们展示了如何将 OTel Collector 每核每秒处理 13.7 万个追踪跨度 (trace span) 提升到 Rotel 的 46.2 万个,并详细说明了多项关键的性能优化。
工具和资源:文末提供了我们在基准测试中所用的工具清单。
引言
在 PB 级规模下运营一个可观测性平台,需要持续关注资源利用效率。即便是每核性能或内存使用上的细微改进,也能大幅降低基础设施开销。
本文源自我们在丹佛举办的一场 ClickHouse 技术见面会的演讲。在会上,我们分享了我们对 Rotel 的开发工作。Rotel 是一个面向大规模系统的高性能 OpenTelemetry 数据平面 (data plane)。
得益于其高压缩比和良好的成本效益,ClickHouse 越来越多地被用于大规模的 OpenTelemetry 负载中。而在这些系统中,OTel Collector 往往是整条数据管道中成本最高的部分。
最近,ClickHouse 发布了一篇关于大规模系统中效率重要性的文章(https://clickhouse.com/blog/scaling-observability-beyond-100pb-wide-events-replacing-otel),并介绍了他们在内部平台 LogHouse 上运行 OTel 的实际经验。
其中有个细节引起了我们的注意:
“OTel Collector:使用超过 800 个 CPU 核传输每秒 200 万条日志。”
按每核每秒约 2500 条日志计算,对于典型的日志行来说,这意味着一个 8 核服务器每秒仅能传输约 10MB,远远低于现代硬件的处理能力。而 ClickHouse 每核每秒最多可处理超过 1.25 万条 OTel 事件,吞吐能力是前者的五倍以上。因此,当前的瓶颈在数据采集端,而非存储端。尽管我们无法复现 ClickHouse 内部的 LogHouse 平台,但我们认为,对现代 OpenTelemetry 数据管道进行基准测试仍具有重要意义。因此,我们希望借此次演讲探讨一个核心问题:将追踪数据发送到 ClickHouse 时,不同的 OpenTelemetry 数据平面表现如何?
Benchmark Framework
Before presenting the results, we first describe the methodology used to evaluate both the OpenTelemetry Collector and Rotel. You can also skip directly to the results section via this link.
Trace Pipeline
Our benchmark focuses on writing trace spans to ClickHouse, as trace data grows extremely fast in large systems. We modeled a highly reliable streaming pipeline, choosing Kafka as the log streaming layer. The test simulates a scenario where many edge collectors send data to a Kafka stream, and a few core collectors batch-write it to ClickHouse. In this pipeline, Rotel and the OTel Collector use the same Kafka Protobuf encoding, so they are interchangeable.

Evaluation Method
We wanted to determine the maximum stable throughput a single collector can sustain under fixed hardware, focusing on collection efficiency rather than scalability. The key was to see how far a single node could be pushed before degradation, staying within our evaluation budget. We chose the gateway collector as the core component under test, because it writes directly to ClickHouse, which is most efficient with large batches. Deploying a few powerful gateway collectors is ideal for batching, so we concentrated on optimizing and measuring that component.
Saturation Detection
We used two key signals to judge when a collector reached its limit:
Memory surge: when backpressure from downstream builds up, the collector buffers data in memory, causing rapid growth. Kafka consumer lag: if the collector cannot keep up with the Kafka stream, the lag grows—the gap between the last read message time and current time widens.
Test Configuration
For each test, we pushed the pipeline to near-saturation for 15 minutes and recorded two key metrics:
Spans per second processed, as recorded by the load generator. Data throughput written to ClickHouse (MB/s), monitored via AWS CloudWatch. Bandwidth helps evenly compare capacity across environments because trace span sizes can vary significantly in practice. In our setup, edge collectors pack and optimize data before sending to Kafka, reducing the total number of messages while increasing individual message size.
We also recorded average CPU usage of Rotel and ClickHouse during tests.
基准测试框架
在进入测试结果之前,我们先介绍一下评估 OpenTelemetry Collector 和 Rotel 所采用的测试方法。如果你感兴趣,也可以直接跳转到结果部分,链接见这里。
追踪数据管道
我们此次基准测试的重点是将追踪跨度 (trace span) 写入 ClickHouse,因为在大型系统中,追踪数据增长极快。我们参考了一个高度可靠的流处理管道进行建模,选用 Kafka 作为日志流层。测试目标是模拟这样一种场景:大量边缘采集器将数据发送至 Kafka 流,由少数几个核心采集器批量写入 ClickHouse。在这个管道中,Rotel 和 OTel Collector 使用相同的 Kafka Protobuf 编码,因此两者可以互换使用。
评估方法
我们希望找出在固定硬件条件下,单个采集器能够稳定支持的最大吞吐量,重点关注的是采集效率,而非系统扩容能力。测试的关键是观察单节点在不降级的前提下可以被“压榨”到什么程度,同时也控制在我们的评估预算范围内。我们选择网关采集器作为测试核心组件,因为它直接将数据输出至 ClickHouse,而后者在处理大批量数据插入时效率最高。为实现更高的批处理效率,部署少量、但能力更强的网关采集器是理想方案,因此我们专注对该组件进行优化与测量。
饱和识别
我们通过两个关键信号来判断采集器是否已达到处理极限:
内存激增:当下游系统产生反压时,采集器会将数据缓存于内存中,导致内存快速增长;
Kafka 消费延迟:如果采集器处理速度赶不上 Kafka 流的速度,其消费延迟会不断增加,即“上次读取的消息时间”与“当前时间”的间隔在变大。
测试配置
每项测试我们都将数据管道运行在接近饱和的边缘状态,持续 15 分钟,记录以下两个关键指标:
每秒处理的追踪跨度数,由负载生成器记录;
向 ClickHouse 写入的数据吞吐量(MB/s),由 AWS Cloudwatch 监控采集。
带宽这一指标有助于统一比较不同环境下的处理能力,因为追踪跨度在实际场景中大小差异可能很大。在测试配置中,边缘采集器会将数据打包优化后发送至 Kafka,这样可以减少消息总数,同时提高单条消息的体积。
测试过程中,我们也记录了 Rotel 与 ClickHouse 的平均 CPU 使用率。
OpenTelemetry ClickHouse Schema
The table schema used in our tests is compatible with both the OpenTelemetry Collector and Rotel. This is one of the officially recommended schemas for ClickHouse and the ClickStack observability platform, supporting OTel metrics, logs, and traces.
OTel's data model relies heavily on key/value attributes to describe critical infrastructure and application characteristics. Originally, these were stored as Map types in ClickHouse. Recently, the OTel Collector introduced support for the JSON column type, allowing the schema to use JSON columns. Although this increases CPU pressure on ClickHouse, it greatly enhances query expressiveness. Our tests enabled this new feature. You can view the complete ClickHouse trace schema we used here (https://gist.github.com/mheffner/dc332a61f3b9ba1d03fd7c7d5c1b7fbb).
We also used the ClickHouse Null table engine, a key optimization. The Null engine accepts writes but does not store data, thus eliminating disk I/O from the equation so we can focus on write throughput and schema correctness. After peak throughput tests, we later evaluate how ClickHouse handles real disk writes.
OpenTelemetry 的 ClickHouse 数据模式
本次测试使用的 ClickHouse 表结构同时兼容 OpenTelemetry Collector 与 Rotel。这一数据模式是官方推荐的方案之一,适用于 ClickHouse 与 ClickStack 可观测性平台,支持 OTel 的指标、日志与追踪数据。
OTel 的数据模型高度依赖键值属性(key/value attributes)来描述基础设施与应用环境中的关键特征,有助于进一步分析。最初在 ClickHouse 中,这类字段采用 Map 类型存储。但近期,OTel Collector 引入了支持 JSON 列类型(JSON column type)的新特性,使得原有结构可以转换为 JSON 格式。虽然这会给 ClickHouse 带来更高的 CPU 压力,但查询表达能力也因此大大增强。我们的测试选择启用这一新特性。你可以在这里查看我们使用的完整 ClickHouse 追踪数据结构(https://gist.github.com/mheffner/dc332a61f3b9ba1d03fd7c7d5c1b7fbb)。
我们的测试配置中还使用了 ClickHouse 的 Null 表引擎,这是一项关键优化手段。Null 引擎可以接受写入请求但不进行实际存储,因此能帮助我们剥离磁盘 I/O 的影响,专注评估写入吞吐能力与数据结构正确性。在完成峰值吞吐的测试后,我们会进一步评估 ClickHouse 如何处理真实的磁盘写入负载。
Load Generator
We initially tried the telemetrygen CLI tool but it struggled to reach the required data volumes. Instead, we used an in-house load generator originally built for testing OpenTelemetry and other telemetry pipelines. The project is available on GitHub in the otel-loadgen repository. It includes enhanced features like end-to-end data delivery validation, which we'll cover in future posts.
We constructed each trace with approximately 100 spans, containing rich attributes and metadata. Like all synthetic tests, this data does not fully mirror real production traffic.
Test Hardware
All benchmarks were run on AWS EC2 instances. Each pipeline component was deployed on a separate instance within the same availability zone to ensure consistency and accuracy.

To maximize disk throughput, we mounted Kafka and ClickHouse data volumes directly on the instance's local NVMe SSDs. All tests used Amazon Linux 2023 with components orchestrated via Docker Compose.
The goal was to evaluate the maximum throughput a single gateway collector host could handle. We chose the m8i.2xlarge instance with 8 vCPUs and 32 GB of RAM. As test scale increased, other pipeline nodes were scaled up, but the gateway collector remained fixed for fair comparison.
负载生成器
我们尝试使用 telemetrygen CLI 工具生成数据,但它难以达到所需的数据量。因此我们改用之前内部构建的负载生成器,该工具最初用于测试 OpenTelemetry 与其他遥测管道。该项目可在 Github 的 otel-loadgen 仓库中找到。它还具备验证端到端数据传输等增强功能,我们将在后续文章中进一步介绍。
我们构造的每个追踪包含约 100 个跨度,涵盖丰富的属性与元数据。和所有合成测试一样,这些数据并不完全等同于真实生产环境中的流量。
测试硬件
所有基准测试均在 AWS EC2 实例上执行。数据管道的每一层组件部署在独立的实例中,所有实例均位于同一可用区,以确保测试结果的一致性与准确性。
为了最大化磁盘吞吐能力,我们将 Kafka 和 ClickHouse 的数据卷直接挂载在实例自带的 NVMe 本地磁盘上。所有测试均使用 Amazon Linux 2023 操作系统,通过 Docker Compose 编排运行各个组件。
本次基准测试的目标是评估单台网关采集器主机所能承载的最高吞吐量。我们最终选择的测试机器为 m8i.2xlarge 实例,配备 8 核 CPU 和 32GB 内存。随着测试规模扩大,数据管道中的其他节点进行了扩容,但网关采集器始终保持不变,便于横向对比。
Testing the OpenTelemetry Collector
We began with the OpenTelemetry Collector, which served as both edge and gateway collector in the test.
Test Configuration

You can view the Docker Compose config here (https://github.com/streamfold/rotel-clickhouse-benchmark/blob/main/docker-compose-otelcoll.yml).
Results:
With a single Collector instance, we hit a performance wall at around 700K spans per second (~40 MB/s). Memory usage then climbed steadily even though CPU utilization remained below 50%.
The OTel Kafka receiver uses a single goroutine to process messages, likely capping throughput. We tried tuning various Kafka parameters, including message size limits, but saw no significant improvement. So we scaled horizontally by adding a second Collector instance on the same host (via Docker Compose scale: 2).
With two instances each consuming half the Kafka partitions, maximum stable throughput reached 1.1M spans per second (69 MB/s). Beyond this threshold, the send queue filled up, memory spiked, and once the queue was full the receiver continued reading but silently dropped data. So while Kafka lag did not increase, we were actually losing trace data!
During the test, the gateway collector's CPU peaked over 83%, becoming the primary bottleneck, while ClickHouse CPU stayed around 23%.

测试 OpenTelemetry Collector
测试从 OpenTelemetry Collector 开始,它在测试中既作为边缘采集器,也作为网关采集器。
测试配置
你可以在这里查看 Docker Compose 的配置文件(https://github.com/streamfold/rotel-clickhouse-benchmark/blob/main/docker-compose-otelcoll.yml)。
测试结果如下:
在运行单个 Collector 实例时,我们在处理速率达到约 70 万个追踪跨度每秒(约 40 MB/s)时遇到了性能瓶颈。此后内存占用开始持续上升,尽管此时 CPU 利用率尚不足 50%。
OTel 的 Kafka 接收器采用单个 goroutine(轻量线程)处理消息,这很可能成为吞吐量的限制瓶颈。我们尝试了若干 Kafka 参数调整,包括消息大小限制等,但都未能显著提升性能。于是我们转向横向扩展方案,在同一主机上启动第二个 Collector 实例(通过 Docker Compose 的 scale: 2 设置)。
当两个 Collector 实例各自消费一半 Kafka 分区后,系统最大稳定吞吐量达到 110 万追踪跨度每秒(69 MB/s)。一旦超过这个阈值,发送队列开始堆积,内存使用迅速上升。当队列完全填满后,Kafka 接收器仍然会继续读取消息,但会直接丢弃数据。这意味着表面上 Kafka 消费延迟没有上升,但实际上我们已经在丢失追踪数据!
测试期间,网关采集器的 CPU 峰值使用率超过 83%,成为主要瓶颈。而 ClickHouse 的 CPU 使用率维持在 23% 左右。
Testing Rotel
Test Configuration

You can view the Rotel Docker Compose config here (https://github.com/streamfold/rotel-clickhouse-benchmark/blob/main/docker-compose-rotel.yml).
Results:
Rotel also uses a single receive loop to pull data from Kafka, similar to the OTel Collector. This suggested a serial bottleneck. As expected, running two Rotel instances on the host and fully utilizing the CPU delivered a significant throughput boost.
With two Rotel instances in parallel, we achieved a maximum stable throughput of 1.45M spans per second (76 MB/s), about 1.3x over the OTel Collector. Pushing load further, we observed Kafka consumer lag slowly increasing, indicating that consumption was nearing its limit.
At this point, the gateway collector CPU hit 91.3%, becoming the new bottleneck; ClickHouse CPU rose to 60.4%.

测试 Rotel
测试配置
你可以在这里查看 Rotel 的 Docker Compose 配置(https://github.com/streamfold/rotel-clickhouse-benchmark/blob/main/docker-compose-rotel.yml)。
测试结果如下:
Rotel 同样使用一个接收循环从 Kafka 拉取数据,与 OTel Collector 架构类似。这使我们初步判断存在串行处理瓶颈。果然,当我们在主机上运行两个 Rotel 实例并充分利用 CPU 后,吞吐量大幅提升。
在两个 Rotel 实例并行运行时,我们实现了每秒 145 万个追踪跨度(76 MB/s)的最大吞吐能力,较 OTel Collector 提升约 1.3 倍。继续提升负载后,我们观察到 Kafka 消费延迟开始缓慢上升,说明消费速率已逼近极限。
此时,网关采集器 CPU 使用率达到 91.3%,成为新的瓶颈;ClickHouse CPU 使用率也升至 60.4%。
Optimizing JSON Encoding in RowBinary Format
In Rotel, we built upon the official Rust ClickHouse library clickhouse-rs. It uses the RowBinary format—a row-oriented binary serialization protocol over HTTP. In contrast, the OTel Collector's Go driver and ClickHouse internals use a column-oriented native protocol.
When handling JSON columns, clickhouse-rs defaults to converting JSON to a string before sending. While ClickHouse does not store JSON columns as raw strings, this stringification is required for transport. However, at high concurrency this is costly: the client must serialize JSON, the server must re-parse it, and both must scan for quotes, backslashes, etc. to escape them. This is especially expensive with large string values.
With help from the ClickHouse Slack community, we discovered that JSON columns can be encoded natively in RowBinary. In this encoding, JSON is serialized as a sequence of key-value pairs: each key is a string, followed by a type tag and the value's raw binary representation. This bypasses the full JSON serialize/parse cycle, enabling more efficient structured data transfer.
For example, consider this simple JSON object:
{ "a": 42, "b": "dog", "c": 98}
The RowBinary encoding looks like this:
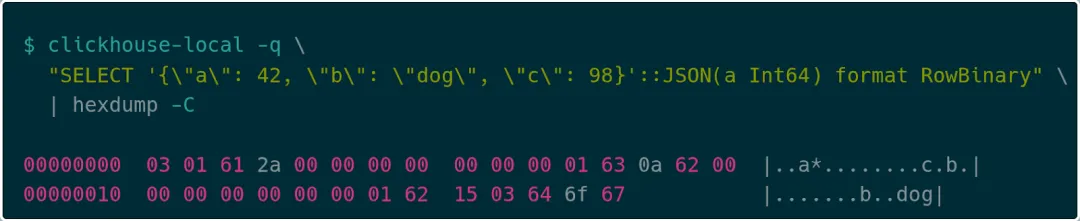
First, the number of key-value pairs is varint-encoded (e.g., 03). Then each pair is encoded: the key length as a varint (01), the key string, then the value. If the value type is statically known (e.g., a is an integer 42), a fixed encoding is used (2a 00 00 00 00 00 00 00). Otherwise, a dynamic type tag is used: for c, 0a denotes Int64, followed by 98 (62 00 00 00 00 00 00 00). Finally, b as string (15), length 03, and "dog".
Compared to traditional JSON transport, this significantly reduces serialization/parsing overhead on both client and server. While clickhouse-rs does not yet natively support this encoding, we plan to contribute it.
Re-test
After upgrading Rotel with the optimized encoding, we re-ran the benchmark. The overall throughput remained at 1.45M spans/sec, but ClickHouse server CPU dropped by about 10%, and gateway collector CPU also slightly decreased. This improvement was consistent across runs, confirming reduced server-side parsing overhead.
Admittedly, our synthetic load did not contain many long strings, and the number of attributes per span may differ from real production. So while client-side gains were minimal here, we believe in real-world scenarios with many attributes and large strings, this faster JSON serialization path will yield more noticeable benefits.

优化 RowBinary 格式下的 JSON 编码
在 Rotel 中,我们基于官方的 Rust ClickHouse 库 clickhouse-rs 进行了改造。该库使用的是 RowBinary 格式——一种面向行的二进制序列化协议,通过 HTTP 与 ClickHouse 进行数据读写。相比之下,OTel Collector 所使用的 Go 驱动和 ClickHouse 内部组件则采用面向列的原生协议。
在处理 JSON 列时,clickhouse-rs 的默认做法是:先将 JSON 内容转为字符串后再发送。虽然 ClickHouse 本身不会以原样字符串存储 JSON 列,但这一“字符串化”过程是为了传输而必须进行的。不过,这样做在高并发情况下代价很大:客户端需要序列化 JSON,服务端则需重新解析,还必须扫描键名和字符串值以转义引号、反斜杠等字符。尤其当字符串体量较大时,这一过程非常耗资源。
在 ClickHouse Slack 社区的帮助下,我们发现其实可以将 JSON 列直接编码为 RowBinary 原生格式。这种方式下,JSON 会被序列化为一系列键值对,每个键为字符串,紧跟一个表示值类型的标签,再跟上该值的原始二进制内容。这种结构可以跳过整个 JSON 的序列化解析过程,从而实现更高效的结构化数据传输。
比如,考虑下面这样一个简单的 JSON 对象:
{ "a": 42, "b": "dog", "c": 98}
复制代码
RowBinary 格式下的编码方式如下:
首先,它会将键值对的数量以变长整数(varint)编码,例如上例中是 03 对;然后逐个对键值对编码。每个键会先写入一个表示字符串长度的 varint(如 01),再写入字符串本身,接着是对应值的编码。如果值的类型在 JSON 声明中已知(如上例中的键 a 是整数 42),那么会直接用固定类型编码,如 2a 00 00 00 00 00 00 00。如果类型未声明,则使用动态类型编码方式,例如键 c 用 0a 表示 Int64 类型,后跟值 98(62 00 00 00 00 00 00 00)。最后,键 b 表示字符串类型(15),跟上字符串长度 03 和字符串内容 “dog”。
相比传统的 JSON 传输方式,这种方法在客户端和服务端两端都能显著减少序列化和解析的资源消耗。虽然 clickhouse-rs 库目前尚未原生支持这种编码方式,但我们计划参与贡献该功能的开发。
重新测试
在将 Rotel 升级为使用上述优化编码后,我们重新进行了性能测试,以评估实际效果。结果显示,虽然总体吞吐量依然维持在之前的峰值——每秒 145 万个跨度未变,但 ClickHouse 服务器的 CPU 使用率下降了约 10%,网关采集器的 CPU 占用也略有减少。这种改善在多次测试中均表现稳定,说明服务端解析负担确实得到了缓解。
需要说明的是,此次测试中使用的合成负载并未包含大量长字符串,同时每个跨度的属性数量也与真实生产环境可能有所不同。因此,虽然客户端的改进不明显,但我们相信,在处理属性字段较多、字符串数据较大的实际业务场景中,这种更快的 JSON 序列化路径将带来更明显的性能收益。
Doubling Throughput with an Unexpected Trick (Diagnosing and Fixing Allocator Lock Contention)
In this round, to fully utilize the gateway host's 8 vCPUs and push throughput to 1.45M spans/sec into ClickHouse, we had to run two Rotel instances. The Kafka receiver logic ran inside a single Tokio async task. The simplified flow:

This had two main issues:
- The whole flow was serial, lacking parallelism.
- Unmarshaling is CPU-intensive and can block Tokio's executor threads.
Tokio is Rust's async runtime using cooperative scheduling. Tasks must yield control at .await points. The community recommends limiting execution between .await points to 10-100 microseconds to avoid hogging the executor.
In Rotel's exporter, we already used a dedicated thread pool for CPU-heavy tasks like serialization and compression. For the Kafka receiver, rust-rdkafka performs decompression on background threads before recv(). But we initially kept unmarshaling inside the Tokio task. Upon analysis, we confirmed unmarshaling was heavily CPU-bound, so we decided to offload it asynchronously to the same exporter thread pool.
After the refactor, the main receive loop looked like:
loop { select! { message = recv() => { unmarshaling_futures.push(spawn_blocking(unmarshal(message))) }, unmarshaled_res = unmarshaling_futures.next() => { send_to_pipeline(unmarshaled_res) } }}
We re-ran the test with a single Rotel instance at the previous 1.45M spans/sec load. The system remained stable. Surprisingly, CPU usage dropped by about 40% compared to before!
Previously, two instances were needed because the single instance couldn't fully utilize the host due to the serial bottleneck in the receiver. Offloading unmarshaling removed that constraint. We expected a single instance could now match the dual-instance throughput.
Seeing such a large CPU drop, we increased the load. Eventually, we pushed throughput to 3.6M spans/sec—a 2x increase from the original 1.45M!
At 3.6M spans/sec, CPU again hit ~93%, saturating the system.

用一个意想不到的技巧将吞吐量翻倍(定位并解决内存分配器锁争用)
在这轮测试中,为了充分利用网关采集器主机的 8 个 vCPU 并将事件吞吐量提升至每秒 145 万条写入 ClickHouse,我们必须同时运行两个 Rotel 实例。Rotel 的 Kafka 接收器逻辑原本运行在一个 Tokio 异步任务中,其处理流程简化如下:
这种实现方式存在两个主要问题:
-
整个处理流程是串行执行的,缺乏并行能力;
-
数据反序列化(unmarshaling)是一项高度依赖 CPU 的操作,容易阻塞 Tokio 的执行线程。
Tokio 是 Rust 语言的异步运行时,采用协作式调度模型。这要求任务在运行过程中需主动在 .await 或其他让出点交还执行权给调度器。网络上已有大量文章探讨该机制的重要性以及忽视它可能带来的严重性能问题。通俗来说,一个 tokio 任务应尽可能靠近 .await 点,业界建议任务在两个 .await 之间的执行时间应控制在 10 到 100 微秒以内。
在 Rotel 的 exporter 模块中,我们使用了一个专用线程池来处理诸如数据序列化与压缩等 CPU 密集型任务。而在 Kafka 接收流程中,rust-rdkafka 库会将解压缩工作分派至后台线程,在调用 recv() 之前完成。但最初我们依然将数据的反序列化逻辑保留在 Tokio 异步任务中。随着分析深入,我们确认反序列化过程极其耗费 CPU,因此决定将其改为异步提交到与 exporter 共用的线程池中,以避免阻塞主线程。
经过这一重构后,Kafka 接收器的主处理循环结构如下:
loop { select! { message = recv() => { unmarshaling_futures.push(spawn_blocking(unmarshal(message))) }, unmarshaled_res = unmarshaling_futures.next() => { send_to_pipeline(unmarshaled_res) } }}
复制代码
我们随后在网关采集器上使用单个 Rotel 实例重新运行测试,并将负载生成器设置为此前的最大值——每秒 145 万个 trace span。结果系统依旧稳定运行。但让我们颇为意外的是:CPU 使用率相比优化前下降了约 40%!
原先我们之所以要运行两个 Rotel 实例,是因为单个实例未能充分利用主机资源,Kafka 接收模块存在明显的串行处理瓶颈。而此次重构将反序列化逻辑迁移至专用线程池后,这一限制被有效解除。我们预期,在这种并行架构下,单实例就能实现与双实例相同的吞吐性能,并维持类似的资源利用率。
在看到 CPU 占用大幅下降后,我们继续提升负载压力。最终,我们成功将吞吐量从每秒 145 万条提升至 360 万条 trace span,实现翻倍增长!
当处理速率达到每秒 360 万条时,CPU 占用再次达到约 93%,系统达到新一轮饱和。
Profiling Rotel's Kafka Receiver with Flamegraph
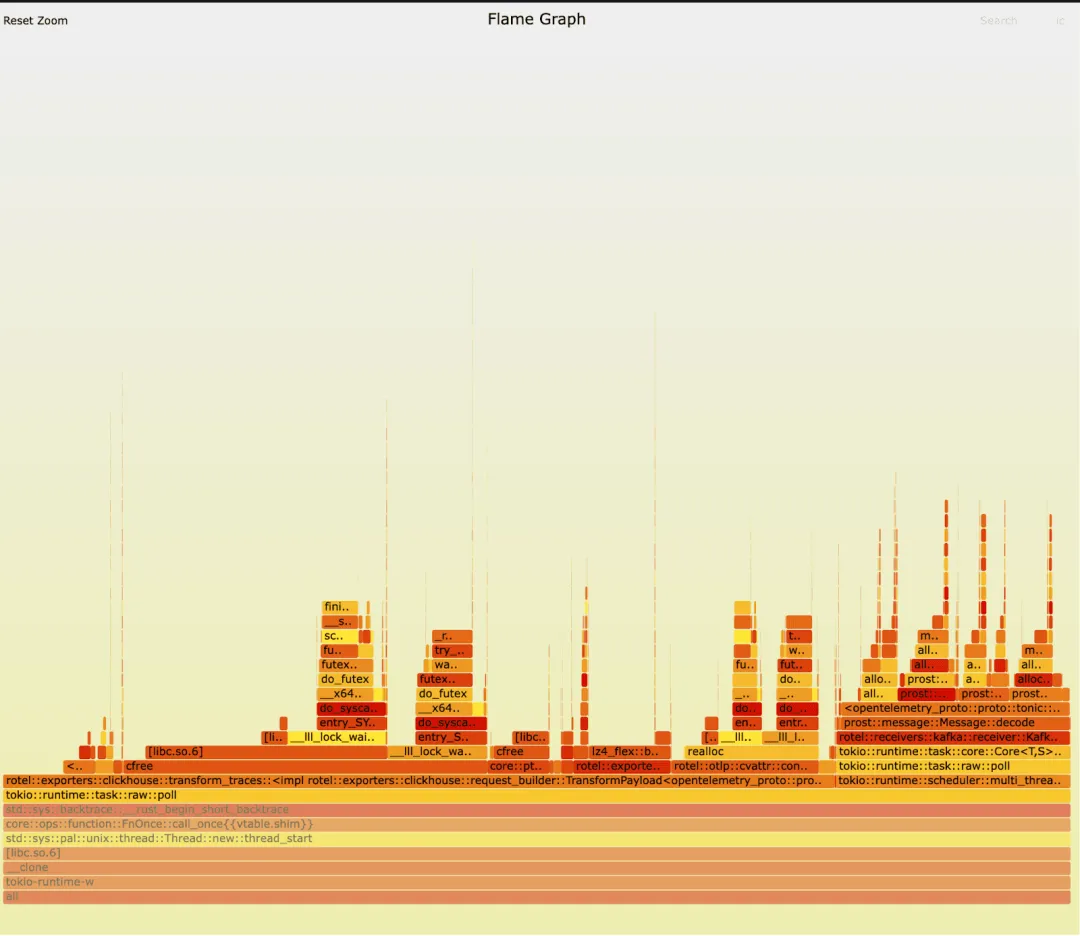
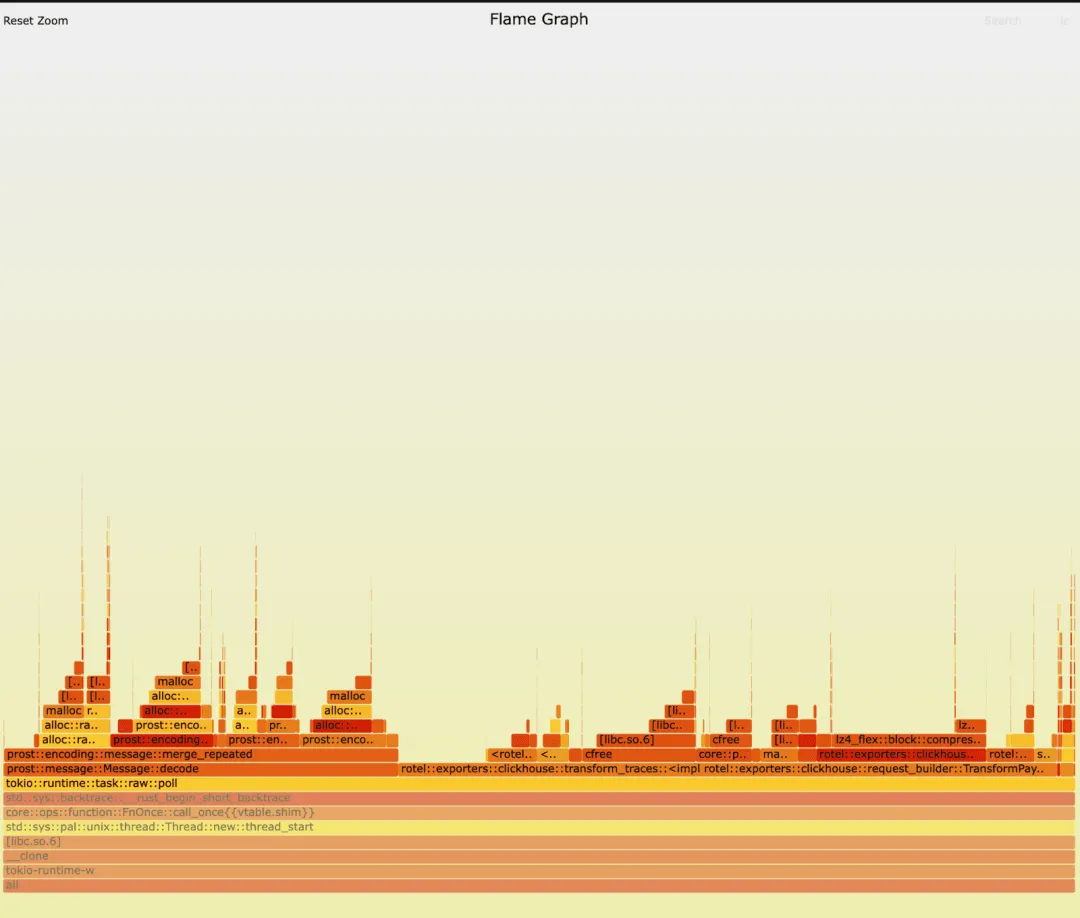
We ran both old and new versions of the receiver and captured flamegraphs. At first glance, there was no obvious difference. Can you spot the key? In both versions, we see most time spent preparing and exporting trace data to ClickHouse, plus significant unmarshaling in prost::message::Message::decode. Such workloads create many short-lived objects, so a lot of time goes to memory allocation and deallocation.
Old version:
New version:
使用 Flamegraph 剖析 Rotel 的 Kafka 接收器
我们针对 Rotel Kafka 接收器的旧版本与新版本重新运行了一轮测试,并捕获了 flamegraph(火焰图)用于性能分析。起初乍一看,两者并未显现出明显差异。你是否能发现其中关键?在两个版本中,我们都观察到:将追踪数据准备并导出至 ClickHouse 占据了主要运行时间,此外,接收器中的消息反序列化操作(在 prost::message::Message::decode 函数中执行)也消耗了相当多的资源。这类负载会创建大量生命周期极短的对象,因此系统在内存分配与释放上耗费了大量时间。
旧版本:
新版本:
Assessing Receiver Changes with Linux Perf
Running perf stat revealed huge differences under the hood.
perf stat -c cycles,instructions,cache-misses,cache-references,context-switches,cpu-migrations
Old version:
295612663445 cycles 264853636815 instructions # 0.90 insn per cycle 615670230 cache-misses # 32.963 % of all cache refs 1867733351 cache-references 1224819 context-switches 1230 cpu-migrations 50.296446757 seconds time elapsed
New version:
150590256805 cycles 287007890213 instructions # 1.91 insn per cycle 598469068 cache-misses # 51.429 % of all cache refs 1163669589 cache-references 37675 context-switches 43 cpu-migrations 43.716966122 seconds time elapsed
The new version averaged 1.91 instructions per cycle and only 862 context switches per second—not stellar ILP, but a clear improvement. The old version achieved only 0.90 IPC with a staggering 24,350 context switches per second—the new version reduced that by ~32.5x! The old version was barely parallel, with threads constantly sleeping and waking, causing huge scheduling overhead.
CPU migrations also improved: the new version saw only 1 migration per second, indicating good cache affinity, versus 24.5/sec in the old version. The scheduler struggled to keep threads pinned.
The new version's better parallelism let us push throughput even higher—all from simply splitting tasks into separate threads.
We initially suspected the old bottleneck was due to blocking Tokio executor threads, leading to heavy polling, spinning, or work-stealing. However, deeper perf report analysis pointed to a more specific issue.
使用 Linux Perf 评估接收器优化前后的变化
通过运行 perf stat,我们发现两个版本在底层表现上差异巨大。
perf stat -c cycles,instructions,cache-misses,cache-references,context-switches,cpu-migrations
复制代码
旧版本
295612663445 cycles 264853636815 instructions # 0.90 insn per cycle 615670230 cache-misses # 32.963 % of all cache refs 1867733351 cache-references 1224819 context-switches 1230 cpu-migrations 50.296446757 seconds time elapsed
复制代码
新版本:
150590256805 cycles 287007890213 instructions # 1.91 insn per cycle 598469068 cache-misses # 51.429 % of all cache refs 1163669589 cache-references 37675 context-switches 43 cpu-migrations 43.716966122 seconds time elapsed
复制代码
新版本平均每周期执行 1.9 条指令,每秒仅发生 862 次上下文切换。尽管这在指令级并行性(ILP)方面不算极致表现,但相较之下已经有明显进步。而旧版本平均仅能达到 0.9 条指令/周期,且上下文切换次数竟高达每秒 24,350 次 —— 新版本将此指标降低了约 32.5 倍!说明旧版本几乎无法并行处理,线程频繁被挂起与唤醒,调度开销巨大。
此外,CPU 迁移数据也显示出改进:新版本平均仅有 1 次迁移/秒,表明线程在相同 CPU 核上保持良好的缓存亲和性,而旧版本则高达 24.5 次/秒。这些迹象显示,旧版本中调度器难以保持线程驻留在固定核心上。
新版本具备更优秀的并行处理特性,使得我们可以进一步扩大吞吐负载。而这一切的背后,仅仅是我们将部分任务拆分至独立线程处理。
我们原先推测旧版本性能瓶颈可能源于 Tokio 执行线程被阻塞,导致运行时不得不频繁轮询、空转,甚至尝试工作窃取。但 perf report 的深入分析为我们揭示了更具体的问题。
Glibc Multi-threaded Memory Allocator Lock Contention
From the data, we can now explain why CPU dropped and throughput increased after the refactor. The old version was wasting CPU cycles on fruitless overhead—specifically, spinning on locks while freeing memory.
To understand this, we need a brief look at glibc's default allocator. Memory is divided into multiple arenas, each protected by a mutex for thread-safe allocation and deallocation. To reduce contention, different threads attempt to use separate arenas, and the number of arenas grows with the thread pool.
The catch: if memory is allocated on thread A but freed on thread B, B must lock the arena associated with A, potentially causing other threads to wait and creating lock contention.
In the old version, we allocated memory for trace data during unmarshaling on Tokio's I/O executor threads—a limited pool of just 8 threads, one per core. Later, that memory was freed during serialization in the ClickHouse exporter, which ran on a large blocking thread pool (tens to hundreds of threads). This cross-thread allocation/free pattern caused frequent arena locking and contention.
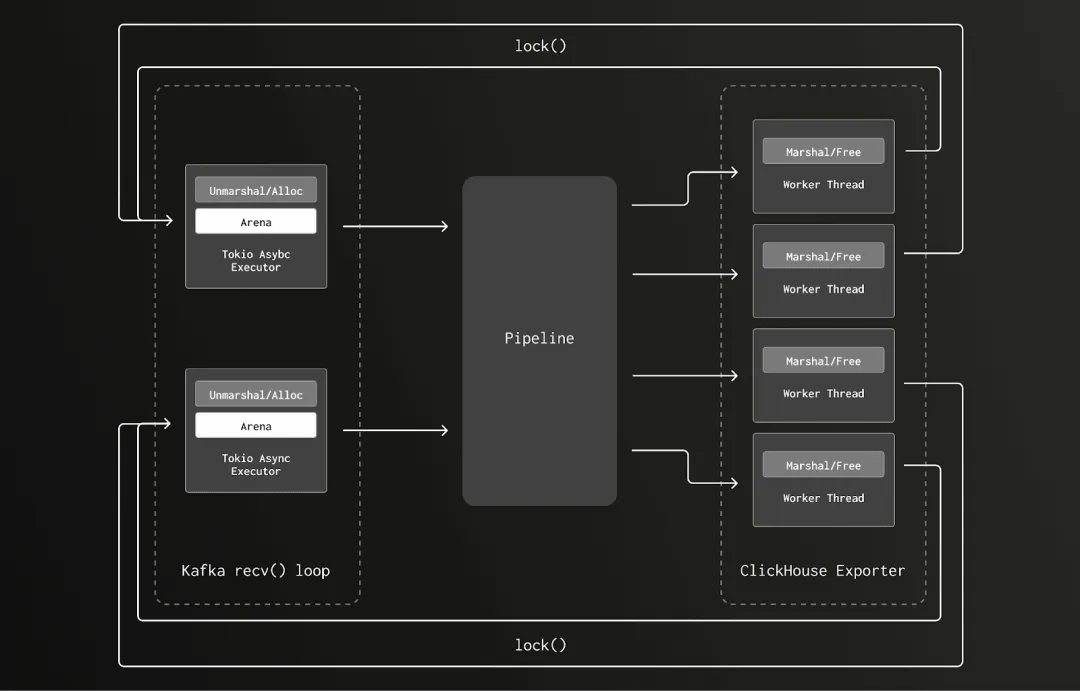
In the new version, we moved unmarshaling's memory allocation to the same blocking thread pool as deallocation, eliminating cross-thread frees. As the pipeline scaled, the thread pool expanded, and so did the number of arenas, drastically reducing lock contention.
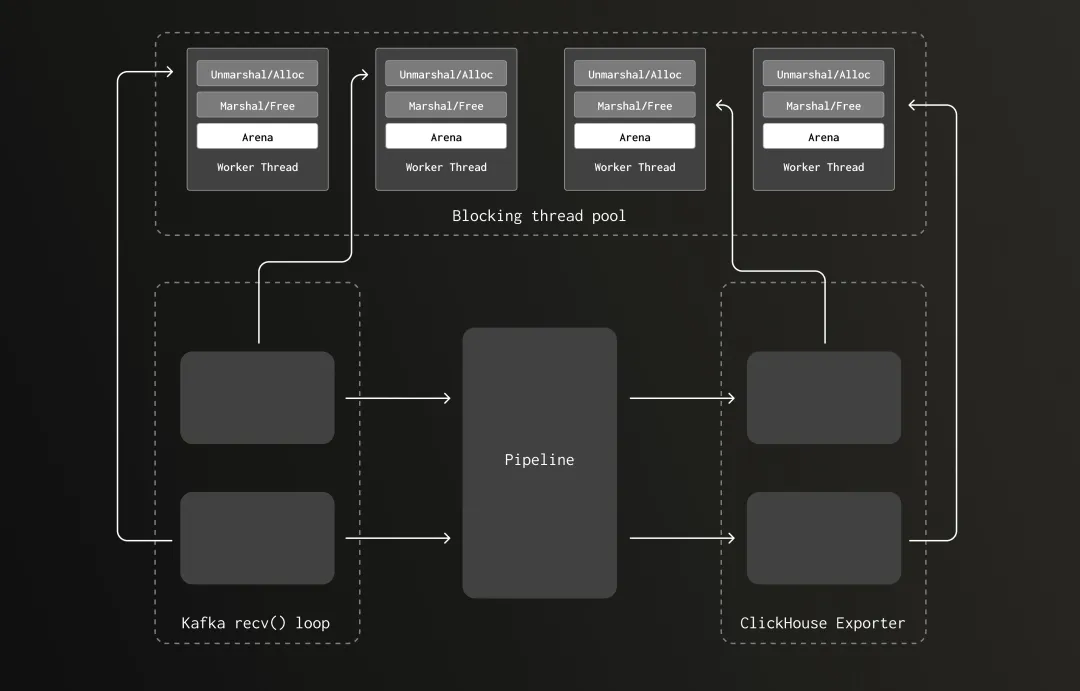
Glibc 多线程内存分配机制下的锁争用问题
从测试数据来看,我们已能清楚解释为何在优化后,系统的 CPU 使用率大幅下降而吞吐能力却反而提升。原先的版本确实消耗了大量计算资源,但主要耗在了无效的系统开销上 —— 本质上,它的大量 CPU 时间都被花在释放内存时的自旋锁等待中。
为了理解这种情况,我们需要简单了解 glibc 默认内存分配器的工作方式。系统将内存划分为多个“arena”(内存区域),每个 arena 都通过一个互斥锁(mutex)来保障内存的分配与释放线程安全。为了减少锁争用,不同线程会尝试创建独立的 arena,随着线程池规模扩大,arena 数量也会同步增长。
但关键在于,如果某段内存在 A 线程上分配,最终却在 B 线程上释放,B 线程就必须锁住 A 所属的 arena,这很容易造成其他线程等待,从而产生锁争用。
在旧版本中,我们在 Kafka 接收器的反序列化(unmarshaling)过程中,于 Tokio 的 I/O 执行线程上分配处理 trace 数据所需的内存。这类异步任务调度在线程数受限的 Tokio executor 上 —— 网关采集器上仅有 8 个线程,刚好一核一个。之后,这段内存在 ClickHouse exporter 的数据序列化过程中被释放,而这部分逻辑则运行在一个大规模阻塞线程池上(包含几十甚至上百个线程)。线程之间频繁切换导致 arena 访问被频繁锁定,进而引发了锁争用问题。
新版本中,我们将反序列化阶段的内存分配也迁移到了与释放操作相同的阻塞线程池中,解决了跨线程释放的问题。随着管道内数据量增加,线程池自动扩展,arena 的数量也随之增加,锁争用的风险被大幅降低。
Verifying Arena Contention: A Jemalloc Comparison
A reviewer asked: "Would switching to jemalloc cause the same issues?" Jemalloc is designed for multi-threaded environments with reduced lock contention. We had tried jemalloc earlier without notable gains, but with higher load on the exporter and receiver changes, memory pressure increased, prompting a re-evaluation.
Switching the old version to jemalloc dropped CPU from 93% to 40%, matching the effect of moving unmarshaling to the shared thread pool—further confirming that lock contention was the core bottleneck.
Although jemalloc eased CPU pressure, under full load Kafka consumer lag increased. Additionally, jemalloc is no longer actively maintained, so we decided against making it the default. However, in the future we may introduce feature flags to allow users to choose custom allocators like jemalloc or mimalloc.
验证 arena 锁争用:Jemalloc 的对比测试
一位审阅本文的工程师提问:“如果换成 jemalloc 分配器,会出现同样的问题吗?”Jemalloc 是一个专为多线程环境优化的内存分配器,目标之一就是减少锁争用。我们曾在早期测试中尝试过 jemalloc,但当时未见显著性能收益。然而,随着 ClickHouse exporter 的负载提升,以及 Kafka 接收器架构的变化,内存分配压力大幅增加,这促使我们重新测试旧版和新版在 jemalloc 下的表现。
我们将旧版本切换为使用 jemalloc 后,CPU 使用率从 93% 降至 40%,与我们将反序列化迁移至共享线程池后的效果几乎一致,进一步印证了锁争用才是核心瓶颈。
尽管 jemalloc 能缓解 CPU 压力,但在满负载条件下,Kafka 消费延迟却有所增加。加上 jemalloc 当前已不再活跃维护,我们决定不将其设为默认分配器。不过,未来我们可能会引入 feature flag,让用户根据需求自由选择 jemalloc、mimalloc 等自定义内存分配器。
Extra Boost: Enabling Fast LZ4 Compression
Rotel uses ClickHouse-recommended LZ4 compression to reduce network data. We use the lz4_flex crate—the same dependency as clickhouse-rs, but as a direct dependency. When adding compression support, we overlooked the feature flag in Cargo.toml.
Lz4-flex offers both safe and unsafe implementations; the unsafe version is higher performance (see Rust docs on unsafe here: https://doc.rust-lang.org/book/ch20-01-unsafe-rust.html). By default, you must explicitly enable the unsafe feature.
clickhouse-rs enables unsafe mode by default, but we had not. After turning it on, throughput increased from 3.6M to 3.7M spans/sec, with compressed network input reaching 209 MB/s.
Gateway collector CPU also dropped slightly.

额外提升:开启快速 LZ4 压缩优化
Rotel 采用 ClickHouse 官方推荐的 LZ4 压缩配置来减少网络传输数据量。我们使用的是 lz4_flex crate —— 与 clickhouse-rs 相同的依赖库,但我们是直接引用的。在引入相关压缩支持时,我们忽略了 Cargo.toml 中的功能标志配置。
Lz4-flex 同时提供安全(safe)和非安全(unsafe)两种实现版本,其中 unsafe 版本的性能更优(关于 Rust 中的 unsafe,请参考官方文档(https://doc.rust-lang.org/book/ch20-01-unsafe-rust.html))。默认情况下,需要显式启用 unsafe 特性才能使用高性能实现。
clickhouse-rs 默认启用了 unsafe 模式,而我们最初未启用此选项。启用之后,我们观察到网关采集器的吞吐能力由每秒 360 万条 trace span 提升至 370 万条,网络压缩输入达到了 209 MB/s。
与此同时,网关采集器的 CPU 使用率也进一步小幅下降。
Full End-to-End Performance Evaluation
After multiple rounds of optimization and initial testing with the Null table engine, we boosted single-instance throughput from 1.1M spans/sec to 3.7M spans/sec—that's 462.5K spans per core per second, a >4x improvement over the initial OTel Collector benchmark.
We then focused on the final link: writing data to ClickHouse with actual disk persistence. Scaling ClickHouse writes typically requires optimizing table schemas for both write throughput and query efficiency. Here we stuck with the default OTel schema, so we primarily relied on high-write-capacity instances.
To handle the massive write load, we deployed ClickHouse on a beefier AWS instance with 4 local NVMe SSDs in RAID0 to avoid disk bandwidth bottlenecks.
During the test, we disabled Rotel's async inserts and increased batch size to --batch-max-size=102400 for efficiency. With --clickhouse-exporter-async-inserts=false, we sustained 3.7M spans/sec at the gateway collector.
ClickHouse CPU hovered around 50%, with compressed write traffic at 210 MB/s.

Visual inspection
Visually, we successfully queried over 3 billion trace records in ClickHouse, confirming end-to-end viability.
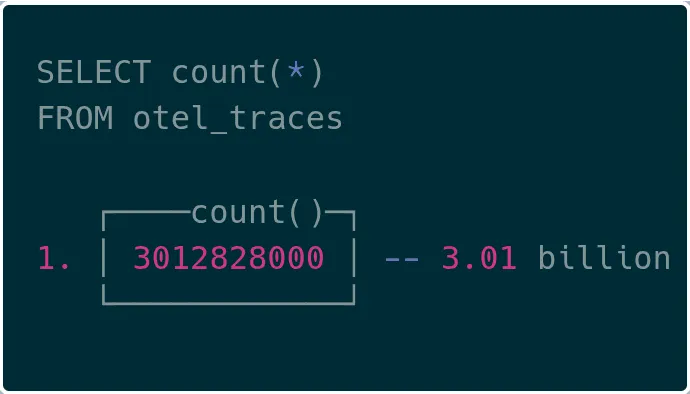
完整的端到端性能评估
在对 Rotel 进行了多轮性能优化,并基于 ClickHouse 的 Null 表引擎完成初步测试后,我们成功将单实例的吞吐能力从最初的每秒 110 万条 trace span 提升至 370 万条,相当于每核每秒处理 46.25 万条。这比最早测试 OTel Collector 所获得的吞吐性能提升了超过 4 倍。
我们随后将评估重点转向了整个链路的最后一环 —— 数据写入 ClickHouse 并真正持久化至磁盘。在扩展 ClickHouse 写入能力时,通常需要从写入性能与查询效率两个维度优化数据表结构。本次测试我们仍采用默认的 OTel 数据模式,因此主要通过选择具备足够写入能力的实例来支撑高负载。
为应对大规模写入负载,我们将 ClickHouse 部署在更高性能的 AWS 实例上,并通过 4 块本地存储构建 RAID0,以确保不会受到磁盘带宽瓶颈限制。
在测试期间,我们关闭了 Rotel 的异步写入功能,并将批处理规模大幅提升至 --batch-max-size=102400,以提升整体写入效率。通过设置 --clickhouse-exporter-async-inserts=false,我们成功维持了每秒 370 万条 trace span 的网关采集器吞吐量。
此时 ClickHouse 的 CPU 占用率约为 50%,压缩后的写入流量达到 210MB/s。
Visual inspection
可视化效果上,我们在 ClickHouse 中成功查询到了超过 30 亿条追踪数据,验证了端到端链路的可用性。
Conclusion
Efficiency Matters at Extreme Scale
ClickHouse's LogHouse platform handling PB-scale observability shows that efficiency is not optional but a necessity. They boosted pipeline throughput 20x while using only 10% of the previous resources. Continuing on the old path would have made operational costs unsustainable. Giants like Netflix and OpenAI have reached the same conclusion: at this scale, efficiency directly impacts business viability.
Against this backdrop, our goal was to improve OpenTelemetry data ingestion efficiency, resulting in Rotel.
Nearly 4x Throughput Increase
We've turned Rotel into a high-throughput OpenTelemetry streaming collector. On the same hardware, Rotel processes almost 4x more than the OTel Collector, leading to significant resource savings at scale. Rotel natively supports OpenTelemetry traces, metrics, and logs. This article focused on traces; we plan to extend benchmarks to logs and metrics.
We're also interested in what features users value most when processing massive data. If you have experience or want to share your scaling practices, join our Discord (https://rotel.dev/discord) or contribute on GitHub (https://github.com/streamfold/rotel).
Future Directions
Here are areas we plan to explore further:
In-depth Kafka Reliable Transport
We briefly touched on Rotel's message reliability. Rotel supports end-to-end message acknowledgement, ensuring at-least-once semantics when reading from Kafka, avoiding potential data loss from relying on Kafka's default auto-commit. We made several pipeline modifications and rigorously tested to prevent both loss and duplication. We plan a dedicated article on its design and validation.
Evaluate ClickHouse Native Protocol
Rotel currently uses clickhouse-rs over HTTP-based RowBinary. In contrast, the OTel Collector uses a Go ClickHouse driver employing the native protocol, which is what ClickHouse uses for inter-node communication. Benchmarks show the native protocol is ~20% faster than RowBinary. ClickHouse also now supports Apache Arrow Flight for efficient columnar transfer. We plan to evaluate replacing RowBinary with these protocols for further gains.
Further Analyze Blocking Tasks in Tokio
Blocking operations like unmarshaling severely impact Tokio's runtime. Having seen this firsthand, we want to explore similar bottlenecks in other paths. For example, Rotel's OTLP receiver currently performs heavy Protobuf deserialization directly in async tasks via the tonic crate. Initial perf observations suggest huge optimization potential by splitting this out.
Optimize Memory Allocation Paths
Although Rust has no GC, high-frequency allocation/deallocation can still be a bottleneck. Rotel creates many short-lived objects. Using a freelist to reuse common buffers could significantly reduce overhead. This is tricky to implement and could increase memory footprint if done incorrectly; it may require deep changes in the tonic crate.
总结
极限规模下,效率至关重要
ClickHouse 内部 LogHouse 平台所运行的 PB 级可观测性场景表明,效率不再是优化选项,而是生存必要条件。他们将管道吞吐能力提升了 20 倍,同时仅使用之前 10% 的资源。如果仍按原有路径扩展,运维成本将变得无法承受。Netflix 与 OpenAI 等大型技术公司也达成了类似共识 —— 当数据量达到如此规模时,效率的优劣将直接影响业务运转。
本项目的目标正是在这一背景下,推动 OpenTelemetry 数据采集效率提升,并推出 Rotel。
近 4 倍的吞吐性能提升
通过本次工作,我们将 Rotel 打造为一款高吞吐量的 OpenTelemetry 流式采集工具。在相同硬件环境下,Rotel 的处理能力几乎是 OpenTelemetry Collector 的 4 倍。这种差异在大规模场景下可以带来显著的资源节省。Rotel 原生支持 OpenTelemetry 的 trace、metric 和 log 类型。本篇文章聚焦追踪数据,未来我们还将扩展基准测试到日志与指标场景。
我们也希望了解,在海量数据处理场景下,用户最看重哪些功能特性。如果你有宝贵经验或希望分享你的扩展实践,欢迎加入我们的 Discord 社区(https://rotel.dev/discord),或在 GitHub 上(https://github.com/streamfold/rotel)提交贡献。
后续方向
以下是我们在完成本次测试后,计划进一步探索的几个方向:
深入探讨 Kafka 的可靠传输机制
本文仅简单提及了 Rotel 的消息可靠性设计。Rotel 支持端到端消息确认机制,确保从 Kafka 中读取数据时实现“至少一次(at-least-once)”语义,避免依赖 Kafka 默认的自动提交机制可能导致的数据丢失。为此我们对数据管道做了多处修改,并进行了严格测试,以确保在避免重复的同时不丢失任何数据。未来我们计划单独撰文,深入介绍其设计与验证方法。
评估 ClickHouse 原生通信协议
Rotel 当前通过 clickhouse-rs 实现与 ClickHouse 的集成,采用基于 HTTP 的 RowBinary 协议。相比之下,OTel Collector 使用 Go 实现的 ClickHouse 驱动,采用的是 ClickHouse 的原生协议。该协议也是 ClickHouse 节点之间通信所用方式,基准测试显示其性能比 RowBinary 高出约 20%。ClickHouse 还新增了对 Apache Arrow Flight 的支持,后者基于内存格式 Arrow 实现高效传输。我们计划评估是否可将 RowBinary 替换为这些列式协议,以进一步提升 Rotel 吞吐性能。
进一步分析 tokio 中的阻塞任务影响
类似反序列化这类阻塞操作对 tokio 的运行时性能影响显著。在本次评估中我们首次直观感受到其影响,因此希望在其他处理路径中继续探讨类似瓶颈。目前我们已知 Rotel 的 OTLP 接收器在处理连接时会在异步任务中直接执行较重的 Protobuf 反序列化操作,该处理逻辑由 tonic crate 承担。我们计划分析如何将其拆分为独立任务。初步通过 perf 工具观察,预计该处存在巨大优化潜力。
优化内存分配路径
虽然 Rust 本身没有垃圾回收机制,但高频率的内存分配与释放在高负载场景中依然会成为瓶颈。Rotel 在处理短生命周期对象时存在大量内存分配行为。如果我们采用内存重用池(freelist)的方式跳过分配器,将常用缓冲区复用,有望显著减少开销。当然,这类机制的实现难度较高,若不慎也可能导致内存占用飙升。我们可能需要深入修改 tonic crate 才能实现该优化。
Appendix
Considered but Not Included
When designing the benchmark, we hoped to include more OTel-compatible data plane tools. However, we found they were incompatible with our pipeline. We chose distributed tracing because it's a key OTel adoption driver and grows fast at scale. Logs and metrics are traditional monitoring areas; many tools still lack robust trace support. Though not covered here, we plan future benchmarks for logs and metrics.
Vector
Vector is a lightweight tool for building high-performance telemetry pipelines with broad source/sink support. It is now developed primarily by DataDog for their observability pipelines product.
However, Vector's OpenTelemetry support is early-stage and cannot interface with many target systems. Its internal data model initially lacked trace structures, so OTel trace support is limited. Because Kafka and ClickHouse output plugins don't yet support trace data, we couldn't include it.
For example, we tried:
Sending trace data from OpenTelemetry source to Kafka sink (https://github.com/vectordotdev/vector/discussions/21018); Storing trace spans in ClickHouse (https://github.com/vectordotdev/vector/issues/17307#issuecomment-1641075239).
Fluent Bit
Fluent Bit is a performance-focused, C-based Fluentd alternative. It offers OpenTelemetry input/output for logs, metrics, and traces, and supports Kafka. In theory, it could form a reliable streaming pipeline.
However, in testing, we found that simultaneously using OTel input and outputting trace and metric data via Kafka or HTTP is not yet fully supported in the current version, ruling it out for this evaluation.
附录
评估过程中考虑但未纳入的项目
在设计本次基准测试框架时,我们曾希望纳入更多支持 OpenTelemetry 的数据平面工具。但实际测试中发现,它们与我们所设定的测试流程并不兼容。我们之所以选择分布式追踪作为测试对象,是因为它是推动 OTel 被广泛采用的关键场景之一,且在大规模系统中数据增长迅速。然而,日志与指标则属于传统监控领域,很多工具对 trace 类型的遥测数据仍缺乏完善支持。因此虽然未在本次测试中覆盖这些工具,我们仍计划未来开展日志与指标方面的基准评估。
Vector
Vector 是一款专为构建高性能遥测数据管道设计的轻量级工具。它支持广泛的数据源和输出目标,能很好地融入多种系统中。该项目目前由 DataDog 主导开发,并被用于其 observability pipelines 产品。
不过,Vector 对 OpenTelemetry 的支持还处于早期阶段,目前尚无法与多种目标系统对接。尤其在 trace 数据方面,其内部数据模型起初并不支持追踪结构,因此目前对 OTel trace 的支持较为有限。由于 Kafka 和 ClickHouse 的输出插件对 trace 数据尚不兼容,我们未能将其纳入此次测试。
例如,我们曾尝试:
从 OpenTelemetry source 向 Kafka sink 发送 trace 数据(https://github.com/vectordotdev/vector/discussions/21018);
在 ClickHouse 中存储 trace span(https://github.com/vectordotdev/vector/issues/17307#issuecomment-1641075239)。
Fluent Bit
Fluent Bit 是一个以性能为重点、由 C 编写的 Fluentd 替代方案。它提供了对 OpenTelemetry 的输入与输出支持,包括日志、指标与追踪数据。Fluent Bit 支持 Kafka 输入输出,因此理论上可用于构建可靠的数据流管道。
然而我们测试发现,当前版本中,在将 OpenTelemetry 作为输入的同时通过 Kafka 或 HTTP 输出 trace 与 metric 数据,尚不完全支持。这一限制使其暂时无法参与本次评估。
Simplifying OTel and ClickHouse Migrations
ClickHouse docs recommend manually creating tables before deployment, rather than relying on exporter auto-creation. But migration scripts are usually bundled inside the OTel exporter and lack a standalone deployment option, making the process non-intuitive.
To address this, we factored the schema management logic out of Rotel into a standalone CLI tool called clickhouse-ddl. It can easily deploy a schema compatible with both Rotel and the OTel Collector.
We packaged it as a Docker image; a single command creates the trace table. Example for a trace span table:
docker run streamfold/rotel-clickhouse-ddl create
--endpoint https://abcd1234.us-east-1.aws.clickhouse.cloud:8443
--traces --enable-json
You can also use the Null table engine for benchmarking, as we did:
docker run streamfold/rotel-clickhouse-ddl create
--endpoint https://abcd1234.us-east-1.aws.clickhouse.cloud:8443
--traces --enable-json
--engine Null
简化 OTel 与 ClickHouse 的迁移操作
根据 ClickHouse 官方文档建议,用户应在部署前手动创建表结构,而不是依赖导出器自动建表。但由于这些迁移脚本通常打包在 OTel exporter 中,缺乏独立部署方式,因此部署过程并不直观。
为了解决这个问题,我们在 Rotel 中将表结构管理逻辑拆分为一个独立的命令行工具 —— clickhouse-ddl,用于便捷地部署数据模式(schema)。该工具可创建与 Rotel 和 OTel Collector 完全兼容的表结构。
我们将该工具封装为一个 Docker 镜像,用户只需运行一条命令即可快速创建用于接收 OTel trace 数据的表。例如,下面是一个用于创建 trace span 表结构的命令示例:
docker run streamfold/rotel-clickhouse-ddl create
--endpoint https://abcd1234.us-east-1.aws.clickhouse.cloud:8443
--traces --enable-json
复制代码
此外,也可以像我们在本篇文章中所做的那样,使用 Null 表引擎来创建 schema,以便进行基准测试:
docker run streamfold/rotel-clickhouse-ddl create
--endpoint https://abcd1234.us-east-1.aws.clickhouse.cloud:8443
--traces --enable-json
--engine Null
复制代码
References
Benchmark framework: https://github.com/streamfold/rotel-clickhouse-benchmark Rotel project: https://rotel.dev OTel load generator: https://github.com/streamfold/otel-loadgen
/END/

Call for Papers
We welcome community submissions on ClickHouse technical research, project practices, and innovations. Style should be informative and richly illustrated. Quality articles will be published on this channel, and outstanding ones may be recommended to the ClickHouse website. Please send your manuscript in WORD format to [email protected].


参考资料
基准测试框架: https://github.com/streamfold/rotel-clickhouse-benchmark
Rotel 项目主页: https://rotel.dev
OTel 负载生成器: https://github.com/streamfold/otel-loadgen
/END/
征稿启示
面向社区长期正文,文章内容包括但不限于关于 ClickHouse 的技术研究、项目实践和创新做法等。建议行文风格干货输出 &图文并茂。质量合格的文章将会发布在本公众号,优秀者也有机会推荐到 ClickHouse 官网。请将文章稿件的 WORD 版本发邮件至:[email protected]。