ClickHouse 可观测性三连发布:MCP Server、AI Notebooks 与 ClickStack 云服务
ClickHouse 在 Open House 上发布了 ClickStack 可观测性的三大更新:全托管的 ClickStack Cloud(私有预览),AI Notebooks(测试版),以及开源的 ClickStack MCP Server。AI Notebooks 将事故排查设计为持久、可分支的调查工作区,而非单一聊天线程;底层直接调用 ClickStack 优化后的调查原语,每一步查询与推理都可见可编辑。MCP Server 将这些原语暴露给外部 AI 代理,内部基准测试显示工具调用减少 25%,一致性提升 2.5 倍;支持双向操作,代理既能分析也能直接在 ClickStack 中创建仪表盘。文章强调“自带代理”的理念,并指出结构化调查工具与原始 SQL 互补:SQL 是任意探索的逃生舱。所有更新都围绕一个方向:让可观测性工具更协作、更可编程,而不是锁定工作流。适合已用或评估 ClickHouse 做可观测性的基础设施/ SRE 工程师。
Open House brought the ClickHouse community together for three days of workshops, technical deep dives, product announcements, demos, and conversations about what’s next for real-time data. We were glad to meet so many users, customers, and members of the observability community throughout the event.
For those who couldn't join us in person, here’s a recap of the observability announcements we shared at Open House.
We announced three major updates across ClickStack and observability: ClickStack Cloud, AI Notebooks in beta, and a new ClickStack MCP server.
Open House 将 ClickHouse 社区聚集在一起,进行了为期三天的工作坊、技术深潜、产品发布、演示,以及关于实时数据未来的讨论。我们很高兴在活动中见到了众多用户、客户和可观测性社区的成员。
对于无法亲临现场的朋友,下面是我们 Open House 可观测性发布的回顾。
我们发布了 ClickStack 和可观测性领域的三大更新:ClickStack Cloud、进入 Beta 阶段的 AI Notebooks,以及全新的 ClickStack MCP 服务器。
The biggest announcement, and one that deserved its own blog post, was the introduction of ClickStack Cloud in private preview.
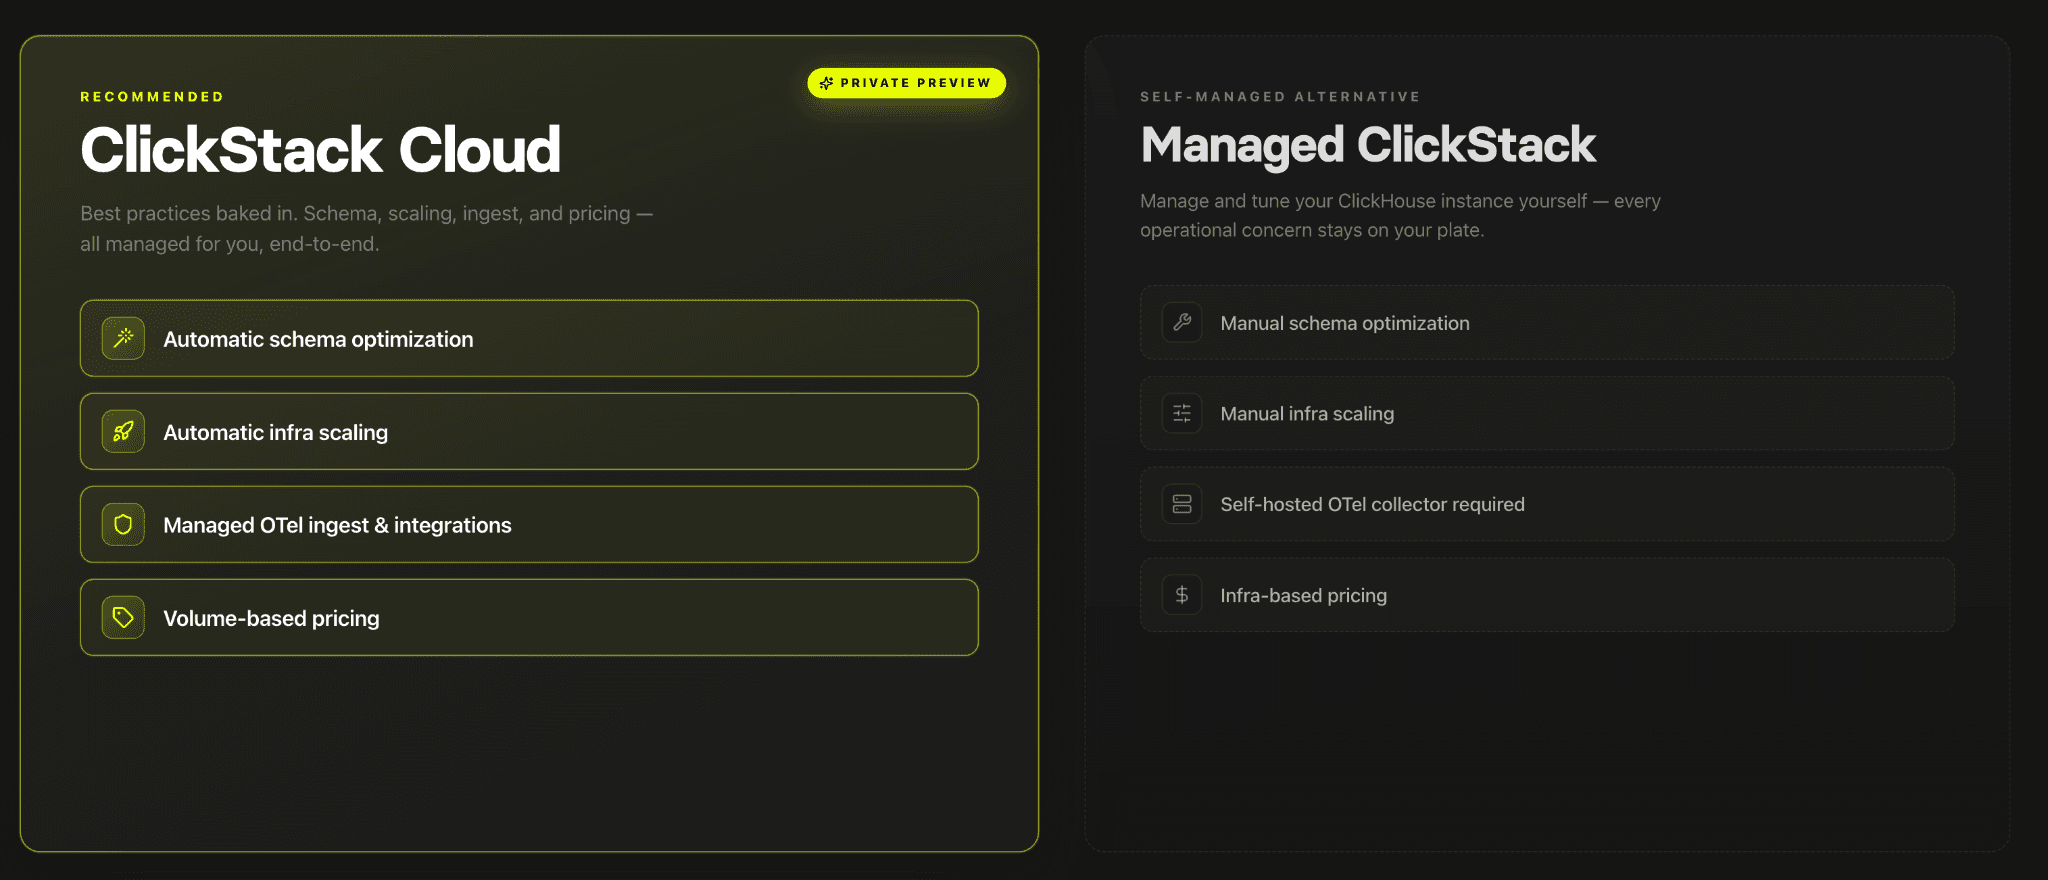
ClickStack Cloud is a fully managed, serverless observability platform built on ClickHouse. Instead of managing collectors, infrastructure sizing, scaling policies, or schema tuning directly, users simply send OpenTelemetry data to a managed endpoint and immediately start exploring logs, metrics, and traces through the ClickStack UI.
ClickStack Cloud is aimed at reducing that operational work while still keeping the performance characteristics people love about ClickHouse.
For more details, we recommend the dedicated post.
最重要的发布,也是值得单独写一篇博文的,是 ClickStack Cloud 以私有预览形式亮相。
ClickStack Cloud 是一个基于 ClickHouse 的全托管、无服务器可观测性平台。用户无需直接管理采集器、基础设施规模规划、弹性策略或 schema 调优,只需将 OpenTelemetry 数据发送到托管端点,即可通过 ClickStack UI 立即开始探索日志、指标和追踪。
ClickStack Cloud 旨在减少运维工作,同时保持用户所喜爱的 ClickHouse 性能特性。
更多细节详见专门的博文。
In addition to ClickStack Cloud entering private preview, our existing Managed ClickStack offering is now generally available.
Managed ClickStack is designed for teams that want direct operational control over their observability stack, including ingestion pipelines, compute sizing, workload isolation, schema design, and datastore tuning. Users manage their own OpenTelemetry collectors and ingestion architecture while using ClickHouse Cloud as the underlying observability datastore. For many large-scale deployments, that control is essential for optimizing performance and achieving market-leading cost efficiency.
Managed ClickStack and ClickStack Cloud are designed for different operational models.
As discussed above, ClickStack Cloud will provide a fully managed, serverless observability experience where teams send telemetry to a managed endpoint and immediately begin exploring logs, metrics, and traces without managing infrastructure directly. Conversely, Managed ClickStack is intended for organizations that want deeper control over scaling strategy, ingestion architecture, and workload optimization while still running on ClickHouse Cloud infrastructure. Together, the two offerings give teams a choice between a turn-key observability experience and a more configurable platform for operating observability at scale.
除了 ClickStack Cloud 进入私有预览外,我们现有的 Managed ClickStack 产品现已正式发布。
Managed ClickStack 面向希望直接掌控可观测性堆栈的团队,包括采集管线、计算规模、工作负载隔离、schema设计和数据存储调优。用户自行管理 OpenTelemetry 采集器和采集架构,并以 ClickHouse Cloud 作为底层可观测性数据存储。对于许多大规模部署场景,这种控制对于优化性能和实现市场领先的成本效率至关重要。
Managed ClickStack 和 ClickStack Cloud 分别针对不同的运营模式而设计。
如前所述,ClickStack Cloud 将提供全托管、无服务器的可观测性体验,团队只需将遥测数据发送到托管端点,无需直接管理基础设施即可立刻探索日志、指标和追踪。相反,Managed ClickStack 适用于希望在 ClickHouse Cloud 基础设施之上,对弹性策略、采集架构和工作负载优化进行更深层次控制的组织。两者结合,为团队提供了开箱即用的可观测性体验与更具配置性的可观测性大规模运营平台之间的选择。
We also announced AI Notebooks entering beta for Managed ClickStack.
Over the last year, nearly every observability platform has added some form of AI chat experience, but we increasingly felt that chat alone does not match how real incident investigations actually unfold. Production debugging is messy, and engineers jump between logs, traces, dashboards, deployments, and hypotheses. They backtrack, split into parallel investigations, and revisit earlier assumptions as new signals appear. Incidents are rarely single-threaded conversations, so we did not want the interface to force them into one.
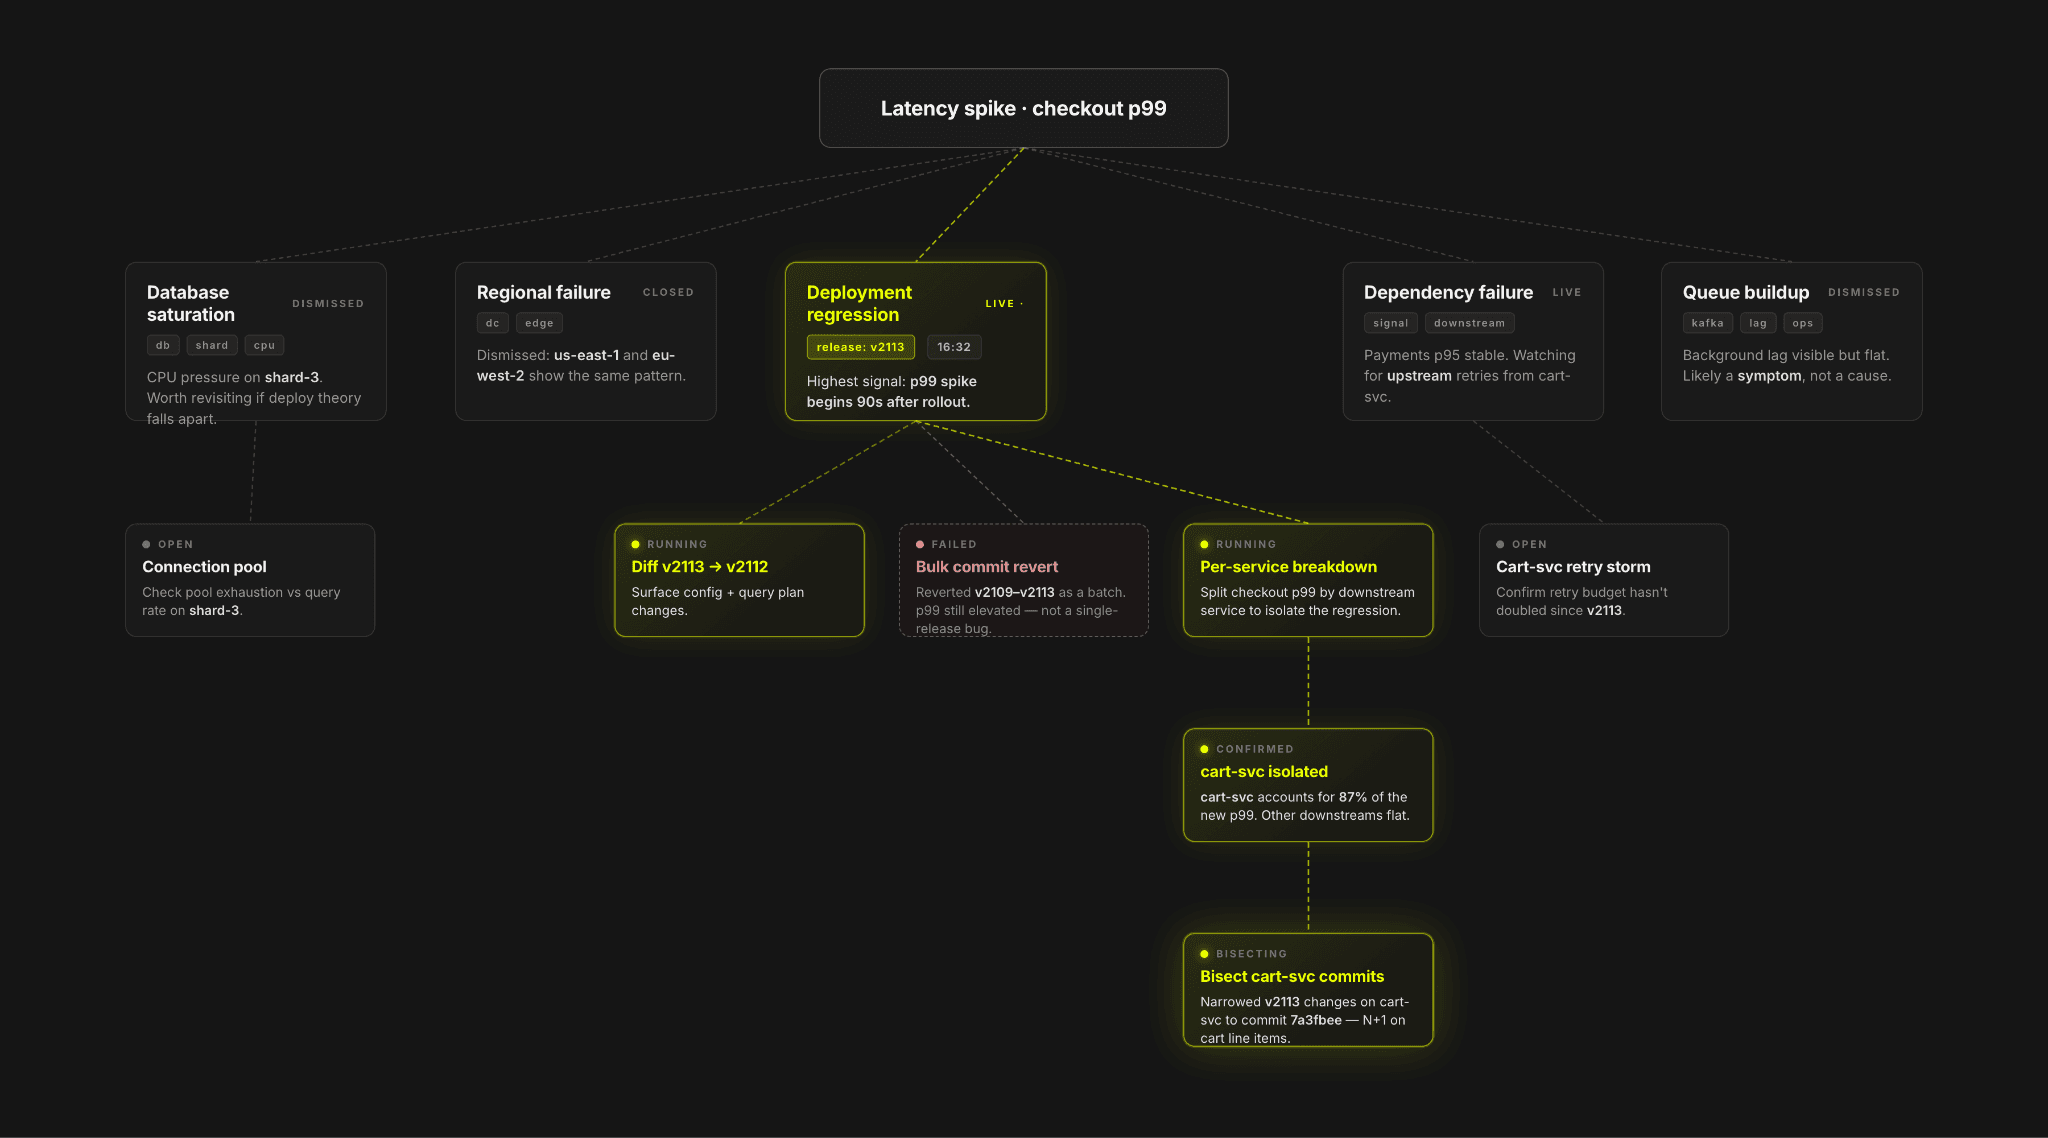
Investigations are rarely single-threaded. SREs typically need to explore multiple branching hypotheses before reaching a resolution.
我们还宣布 AI Notebooks 在 Managed ClickStack 中进入 Beta 阶段。
过去一年里,几乎所有可观测性平台都添加了某种形式的 AI 聊天体验,但我们越来越觉得单纯的聊天并不符合真实事件调查的展开方式。生产环境的调试过程是混乱的,工程师们需要在日志、追踪、仪表盘、部署记录和假设之间频繁跳转。他们会回溯、分叉出并行的调查路径,并在新信号出现时重新审视之前的假定。事件调查很少是单线程对话,因此我们不想让界面迫使它们变成那样。
调查很少是单线程的。SRE 通常需要在达成结论前探索多个分支假设。
AI Notebooks are designed as a persistent investigative workspace rather than a transient chat session. Each investigation becomes a structured sequence of prompts, queries, charts, reasoning steps, and findings that remain visible and editable throughout the process.
Engineers can branch from any point in the notebook to explore alternative theories without losing previous work or context. In practice, the workflow feels more like a collaborative debugging experience.
We were also pretty opinionated about transparency while building this. In a production incident, engineers need to understand what the system is actually doing, especially if AI is involved in the investigation loop. Every query, chart, reasoning step, and intermediate result is visible inside the notebook. You can edit queries manually, insert your own searches, or ignore the suggested path entirely and take the investigation somewhere else. We wanted the AI to behave more like a collaborator sitting beside the engineer than a system producing black-box conclusions in the background.
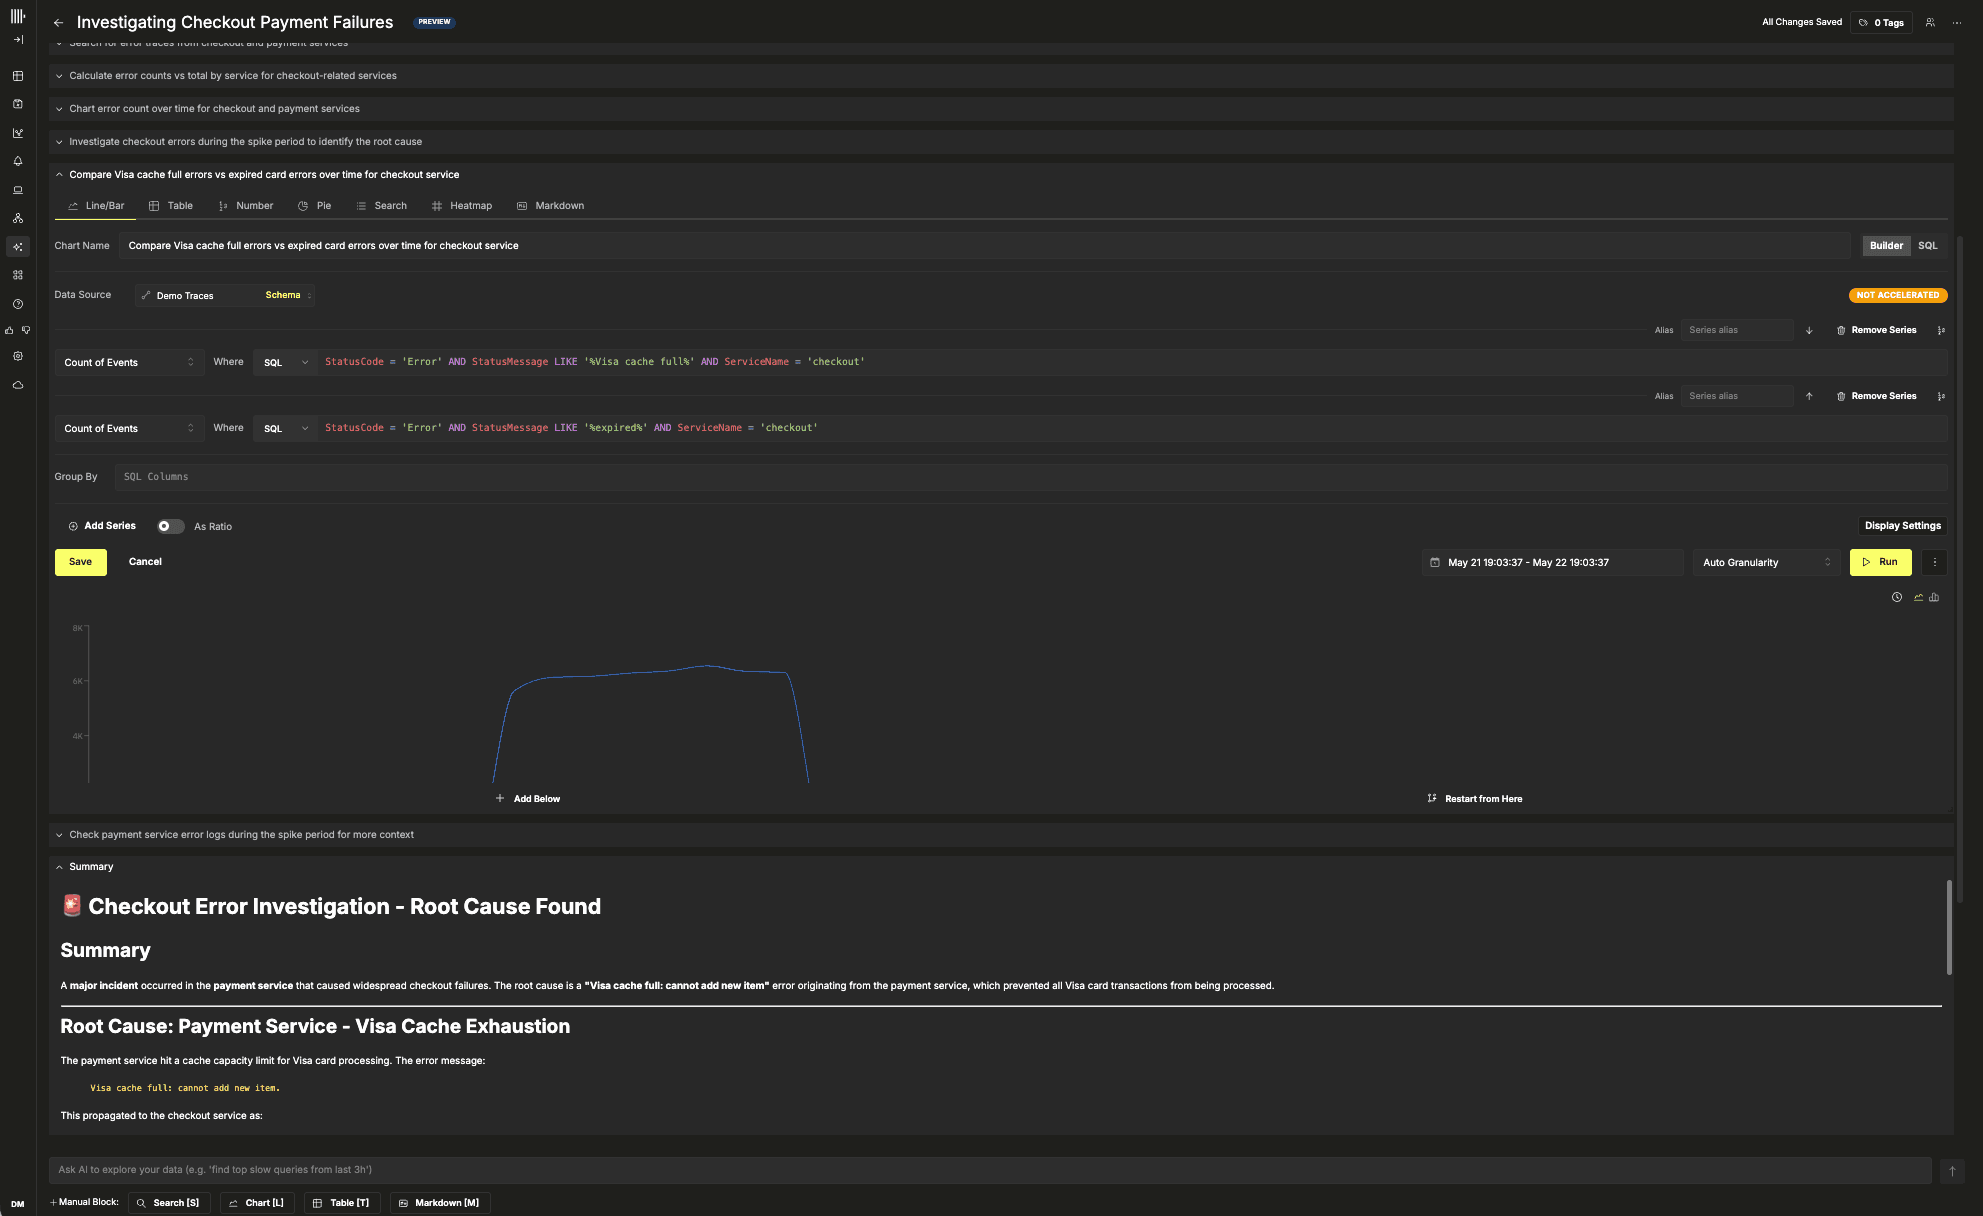
Underneath the interface, Notebooks are built directly on top of ClickStack’s observability primitives and optimized ClickHouse workflows. The system is not simply attaching an LLM to a SQL console. The model operates against structured investigative tools that already power ClickStack itself, allowing it to execute optimized searches, aggregations, and visualizations while still exposing the generated queries for inspection and refinement. Notebooks can also be shared across teams, turning investigations into persistent collaborative artifacts instead of disposable chat histories that disappear once the incident ends.
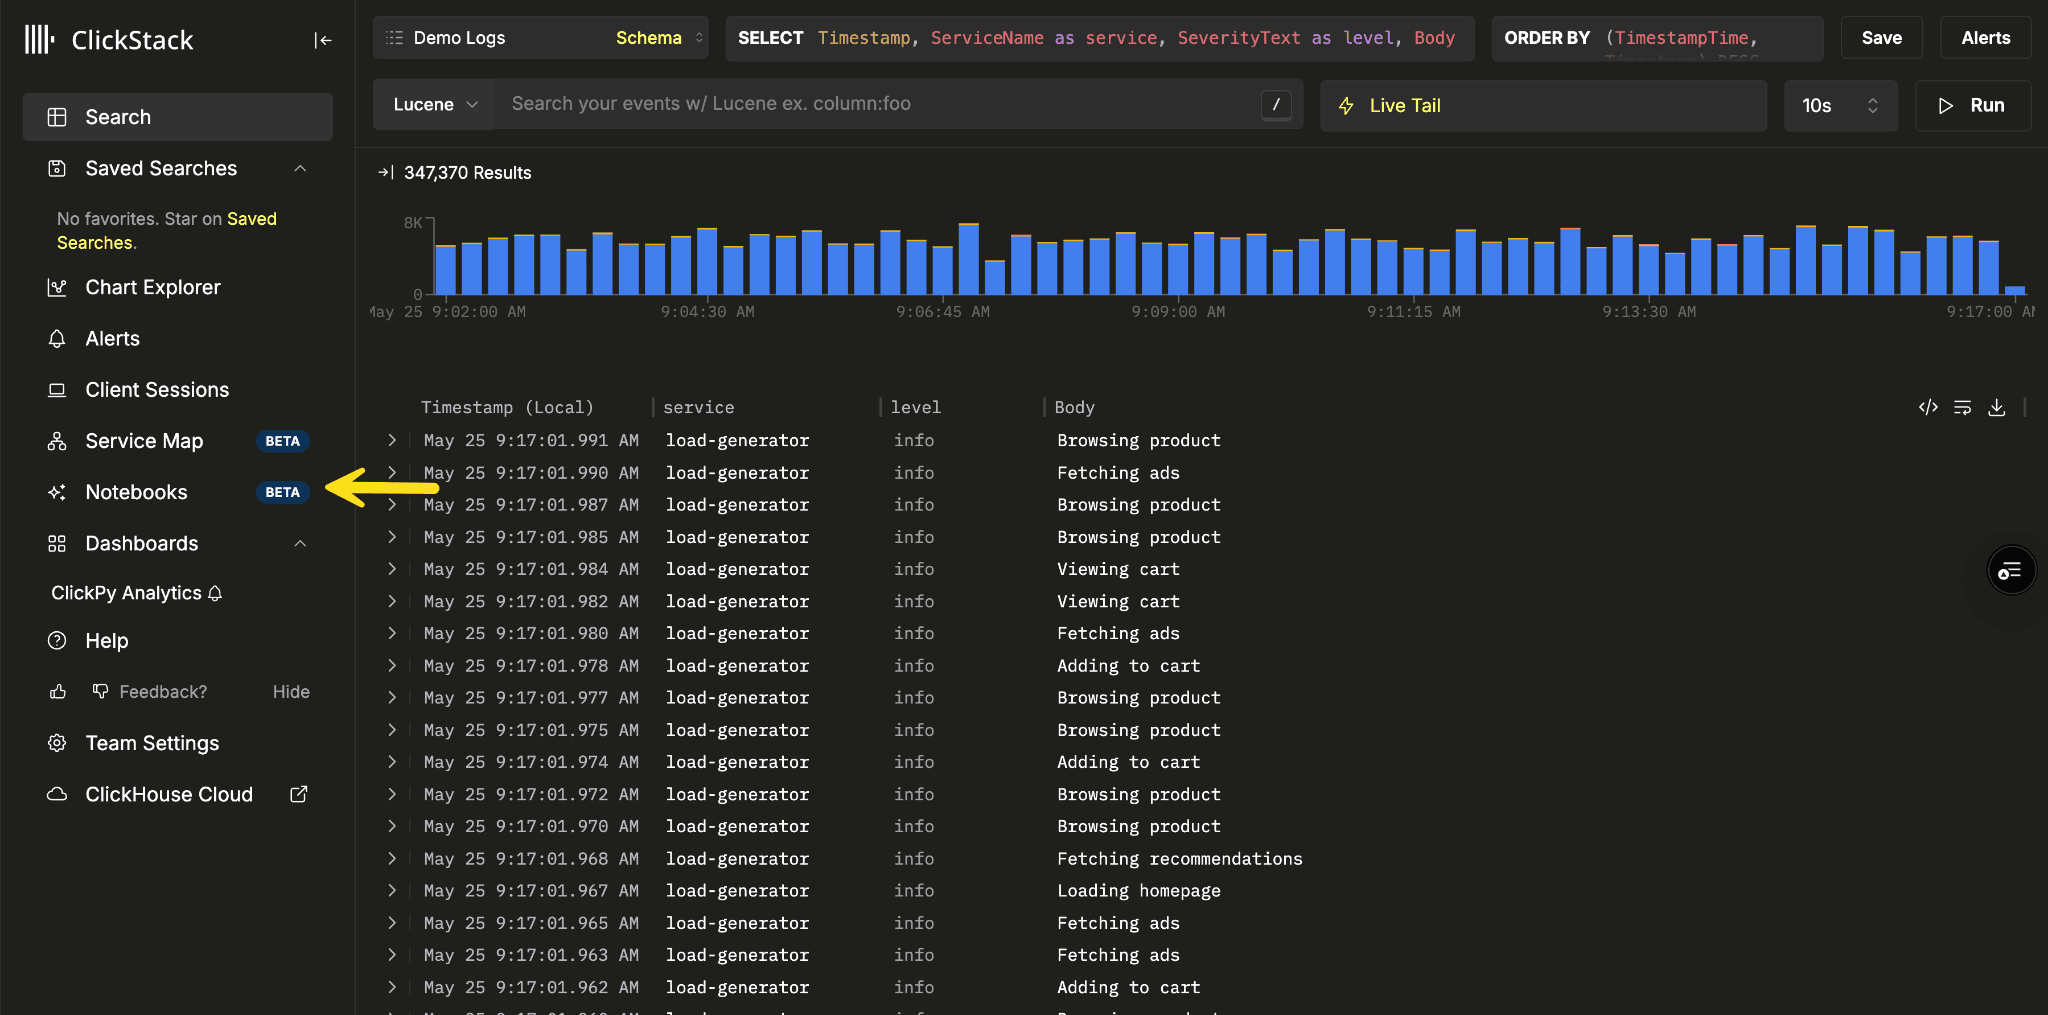
For users already running Managed ClickStack, AI Notebooks are now available directly from the left navigation panel inside the ClickStack UI.
AI Notebooks 被设计为一个持久化的调查工作区,而非转瞬即逝的聊天会话。每次调查都会形成一组结构化的提示、查询、图表、推理步骤和发现,这些内容在整个过程中保持可见且可编辑。
工程师可以从笔记本的任意节点分叉,探索替代理论,而不会丢失先前的工作或上下文。实际操作中,这种工作流更像是协作式调试体验。
在构建过程中,我们还坚持了对透明性的明确立场。在生产事件中,工程师需要理解系统实际在做什么,尤其是当 AI 参与调查循环时。每一条查询、每一个图表、每一步推理以及中间结果都在笔记本中可见。你可以手动编辑查询、插入自己的搜索,或者完全忽略建议路径,将调查引向别处。我们希望 AI 更像一位坐在工程师身旁的协作者,而非在后台产生黑盒结论的系统。
在界面之下,Notebooks 直接构建在 ClickStack 的可观测原语和经过优化的 ClickHouse 工作流之上。该系统并非简单地将一个 LLM 挂接到 SQL 控制台上。模型运行在已经支撑 ClickStack 本身的结构化调查工具之上,使其能够执行优化后的搜索、聚合和可视化,同时仍然暴露生成的查询以供检查和优化。Notebooks 还可以跨团队共享,将调查转变为持久的协作产物,而非事件结束后就消失的可丢弃聊天记录。
对于已在运行 Managed ClickStack 的用户,现在可以直接从 ClickStack UI 左侧导航面板访问 AI Notebooks。
Finally, the Notebook experience also naturally led us to our third observability announcement at Open House. As part of building structured investigative workflows inside ClickStack, we also introduced a new ClickStack MCP server, allowing external AI systems and agents to integrate directly with the same observability primitives that power Notebooks internally.
Alongside Notebooks, we also spent time at Open House discussing a broader shift we think is underway in AI and observability tooling.
While AI-assisted investigation inside ClickStack matters, we think teams will want to leverage the same powerful tools we expose within ClickStack in their own agents. Increasingly, users are building their own agents, prompts, workflows, and automation around observability data. Some are doing this inside Cursor or Claude Code. Others are wiring together SDKs and running agents locally against internal systems. In many cases, the teams building these workflows already have strong operational knowledge baked into how they debug incidents, and they want their tooling to reflect that.
Our view is that observability platforms should meet users where they already work instead of forcing them into a single AI experience, and we want to build based on a “Bring your own agents” philosophy.
The first step is to expose the same investigative building blocks that power ClickStack Notebooks internally and make them available to external agents and workflows. For this, we are pleased to announce the ClickStack MCP server in open source ClickStack.
There is already a generic ClickHouse MCP server available today, and it works well for broad analytical tasks and SQL-driven exploration. But while building AI Notebooks, we repeatedly found that observability workflows behave differently from general BI workloads. Models perform much better when they operate against structured investigative tools rather than generating raw SQL queries over and over again.
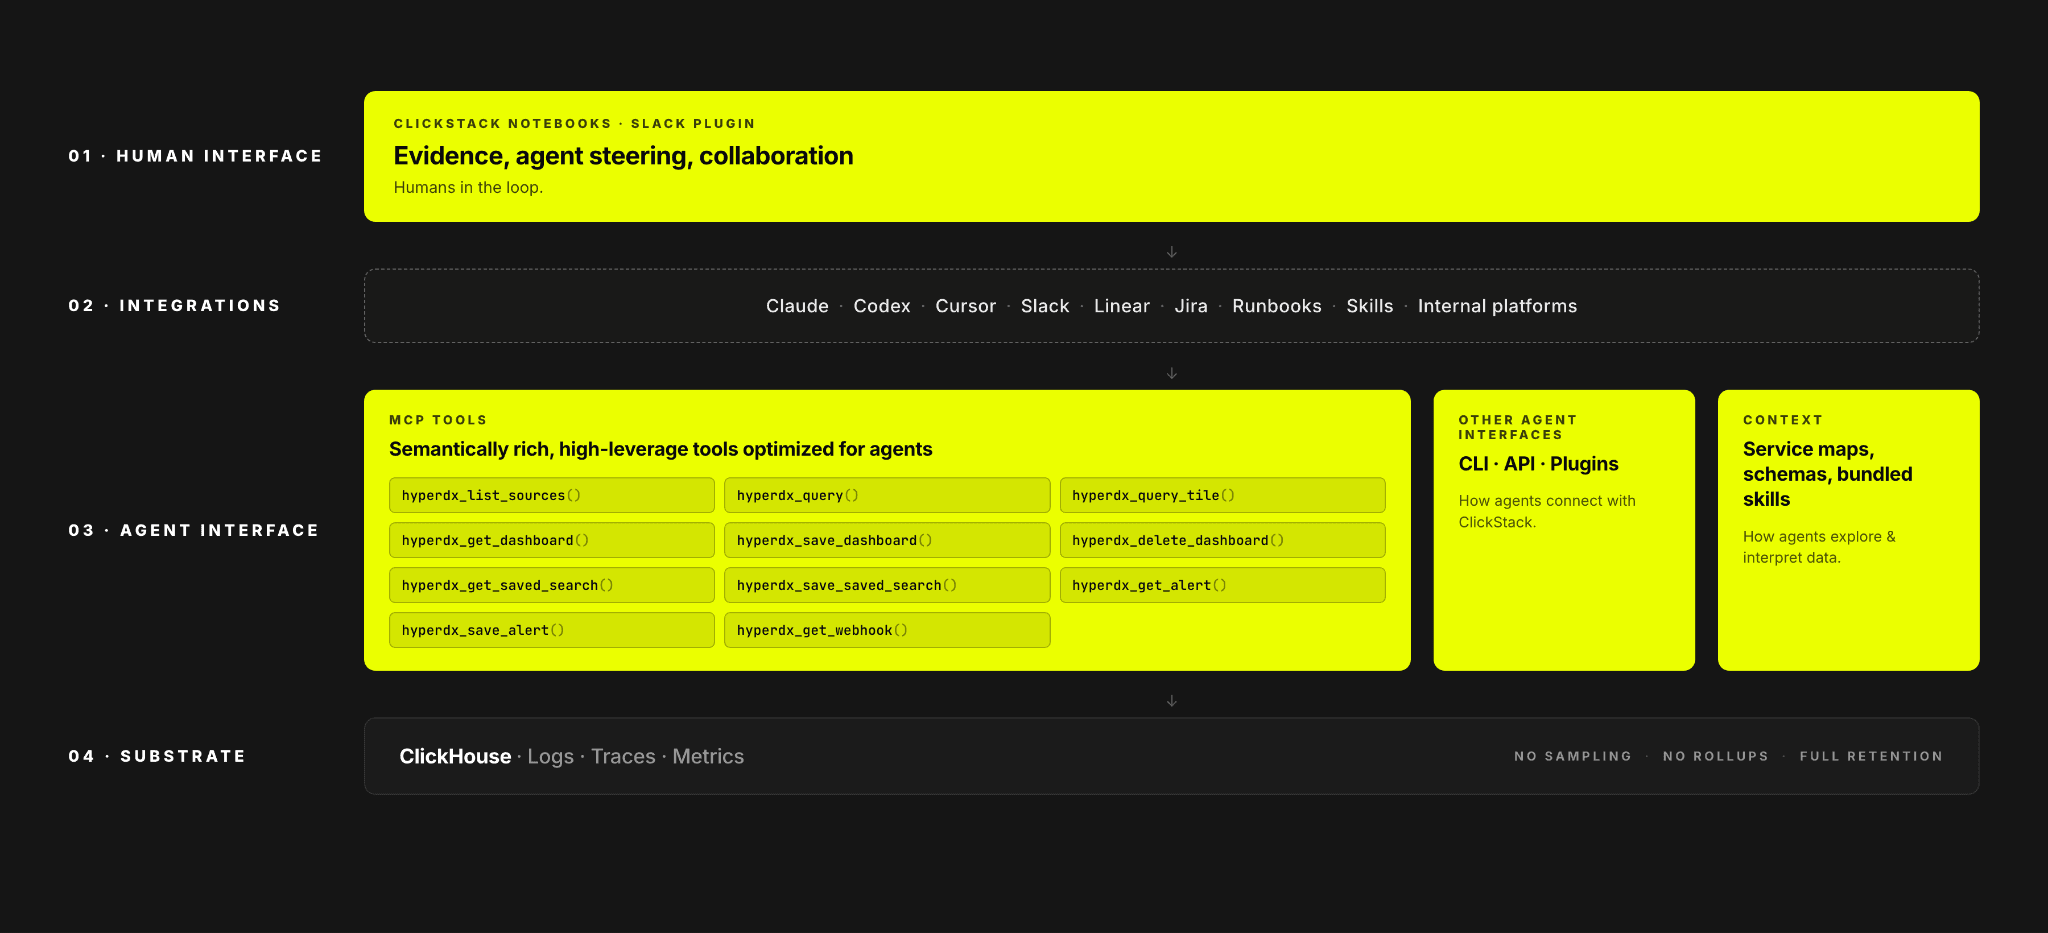
AI for observability with ClickHouse combines collaborative notebook experiences and MCP tools delivered through ClickStack, integrations with external agents such as Claude and Codex, and ClickHouse as the high-performance analytics engine enabling full-fidelity investigations with sub-second query performance and high concurrency at scale.
最终,Notebook 体验也自然引出了我们在 Open House 的第三个可观测性发布。作为在 ClickStack 内部构建结构化调查工作流的一部分,我们还推出了全新的 ClickStack MCP 服务器,使外部 AI 系统和智能体能够直接与支撑 Notebooks 的相同可观测原语集成。
在 Notebooks 之外,我们还在 Open House 上花时间讨论了一个我们认为正在发生的更广泛转变,即 AI 和可观测性工具链的演化。
虽然 ClickStack 内部的 AI 辅助调查很重要,但我们认为团队会希望在自己构建的智能体中利用我们在 ClickStack 中暴露的同样强大的工具。越来越多的用户正在围绕可观测性数据构建自己的智能体、提示词、工作流和自动化。其中一些在 Cursor 或 Claude Code 中完成,另一些则将 SDK 组合起来,在本地针对内部系统运行智能体。在许多情况下,构建这些工作流的团队已经将深厚的运维知识融入到他们调试事件的方式中,并希望工具链能体现这一点。
我们的观点是,可观测性平台应该适应用户已有的工作方式,而不是强迫他们进入单一的 AI 体验,我们希望基于“自带智能体”(Bring your own agents)的理念进行构建。
第一步是将支撑 ClickStack Notebooks 的相同调查构建块暴露出来,使其可用于外部智能体和工作流。为此,我们很高兴地宣布在开源 ClickStack 中推出 ClickStack MCP 服务器。
目前已经有一个通用的 ClickHouse MCP 服务器可用,并且对于广泛的分析任务和 SQL 驱动的探索效果不错。但在构建 AI Notebooks 的过程中,我们反复发现可观测性工作流与一般的 BI 工作负载行为不同。当模型针对结构化的调查工具操作,而不是一遍又一遍地生成原始 SQL 查询时,表现要好得多。
将 ClickHouse 用于可观测性 AI,结合了通过 ClickStack 交付的协作式笔记本体验和 MCP 工具,与 Claude、Codex 等外部智能体的集成,以及作为高性能分析引擎的 ClickHouse,实现了全保真度的调查,具备亚秒级查询性能和大规模高并发能力。
Raw SQL is powerful, but many observability investigations are awkward to express as one-off queries. Tasks like mining recurring log patterns, comparing behavior across time windows, root causing trace outliers, or following an investigation across logs, metrics, and traces require multi-step analysis and domain-specific logic. Leaving all of that to the model means it has to reconstruct the required query patterns and analysis logic from scratch each time, spending context on query mechanics instead of the problem itself.
The ClickStack MCP server gives agents higher-level semantic tools for observability work. Instead of exposing only a raw SQL interface, it provides stable tools for finding trends in patterns of logs, correlating attributes with outliers, inspecting slow traces, and moving through an investigation with repeatable workflows. Under the hood, those tools still execute optimized ClickHouse queries, but the agent interacts with intent-level operations rather than hand-assembling complex analysis every time.
This is the same approach used inside AI Notebooks. The model is not manually stitching together large SQL statements for every step of an investigation. Instead, it works against specialized tools that already understand the underlying observability workflows and ClickStack optimizations.
In our internal benchmarks, investigations completed with 25% fewer tool calls, showed a 2.5x increase in consistency and improved evaluation scores by almost 20% vs the standard ClickHouse MCP. A large part of that came from giving the model high-leverage semantic investigation tools instead of forcing it to generate every workflow from raw SQL alone.
原始 SQL 很强大,但许多可观测性调查如果用一次性查询来表达会很别扭。比如挖掘重复出现的日志模式、比较不同时间窗口的行为差异、定位追踪异常的根因,或是在日志、指标和追踪之间联动调查,这些都需要多步分析和领域特定逻辑。如果把这些全部丢给模型,它每次都得从头构建所需的查询模式和分析逻辑,将上下文消耗在查询机制上,而非问题本身。
ClickStack MCP 服务器为智能体提供了用于可观测性工作的高层语义工具。它并非只暴露一个原始 SQL 接口,而是提供一组稳定的工具,用于发现日志模式中的趋势、将属性与异常值关联、检查慢追踪,并以可重复的工作流推进调查。在底层,这些工具仍会执行优化后的 ClickHouse 查询,但智能体与意图层面的操作交互,避免了每次都手工拼凑复杂的分析。
这与 AI Notebooks 内部使用的方法相同。模型并非在调查的每一步都手动拼接大型 SQL 语句,而是与已经理解底层可观测性工作流和 ClickStack 优化的专用工具协同工作。
在我们的内部基准测试中,与标准 ClickHouse MCP 相比,调查完成所需的工具调用次数减少了 25%,一致性提高了 2.5 倍,评估得分提升了近 20%。其中很大一部分原因在于,我们为模型提供了高效能的语义调查工具,而不是强迫它从原始 SQL 生成每一个工作流。
At the same time, we do not think structured investigative tools should completely replace direct SQL access.
One of the reasons ClickHouse works so well for agentic workloads and observability is that SQL remains an incredibly powerful exploratory language. Sometimes an incident eventually reaches a point where there is no higher-level abstraction that helps anymore, and you simply need direct access to the underlying data. The structured tools handle many of the repetitive and common investigation paths efficiently, but SQL remains the escape hatch when engineers or agents need to go deeper, test unusual hypotheses, or answer questions the system was never explicitly designed around.
In practice, the workflows end up complementing each other quite naturally: use optimized investigative primitives for the majority of the investigation, then drop into native queries when the situation calls for it.
与此同时,我们不认为结构化调查工具应该完全取代直接的 SQL 访问。
ClickHouse 在智能体工作负载和可观测性方面表现出色的原因之一,是 SQL 依然是一门极其强大的探索性语言。有时候事件调查会深入到没有任何高层抽象能提供帮助的地步,你只需要直接访问底层数据。结构化工具高效处理了许多重复和常见的调查路径,但当工程师或智能体需要深入挖掘、测试非常规假设,或回答系统从未明确设计过的问题时,SQL 就是那个逃生舱。
在实践中,这两种工作流自然地相互补充:在调查的大部分工作中使用优化后的调查原语,当情况需要时再切换到原生查询。
While some engineers are perfectly happy working directly in the terminal or inside an agent harness like Claude Code, investigations eventually need to be shared with other people. SREs need to collaborate, preserve context, and present evidence once they reach a conclusion.
That is why we do not think observability MCP servers should only expose investigative primitives. Real operational workflows also require orchestration primitives for creating dashboards, persisting searches, managing alerts, and sharing findings across teams.
This becomes especially important for local agent workflows. If an agent investigates an incident locally, the resulting evidence needs to be persisted somewhere for sharing and review by the larger team. Copying raw chat output into documents or generating static reports quickly breaks down during real incidents, leading to inconsistencies.
For that reason, the ClickStack MCP server exposes bi-directional management tools directly inside ClickStack itself. Agents can not only investigate incidents, but also create dashboards, persist searches, and validate that the resulting artifacts contain the required evidence and visualizations.
In practice, investigations naturally evolve into persistent operational artifacts rather than disposable chat histories.
虽然一些工程师完全乐于直接在终端或 Claude Code 这样的智能体框架中工作,但调查最终都需要与人分享。SRE 需要协作、保留上下文,并在得出结论后展示证据。
这就是为什么我们认为可观测性 MCP 服务器不应只暴露调查原语。真正的运维工作流还需要编排原语,用于创建仪表盘、持久化搜索、管理告警,以及跨团队分享发现。
这对本地智能体工作流尤为重要。如果一个智能体在本地调查了某个事件,产生的证据需要被持久化到某个地方,以便更大团队分享和审查。直接将原始聊天输出复制到文档中或生成静态报告,在真实事件中很快会失效,导致不一致。
因此,ClickStack MCP 服务器直接在 ClickStack 内部暴露了双向管理工具。智能体不仅可以调查事件,还能创建仪表盘、持久化搜索,并验证生成的产物是否包含所需的证据和可视化。
在实践中,调查自然会演变成持久的运维产物,而非可丢弃的聊天记录。
Getting started with the ClickStack MCP server is straightforward. The easiest way to try the full stack locally is to use the ClickStack all-in-one container, which includes ClickHouse, the ClickStack UI (HyperDX), an OpenTelemetry ingestion endpoint, and the MCP server.
1docker run --name clickstack
2 -p 8123:8123
3 -p 8080:8080
4 -p 4317:4317
5 -p 4318:4318
6 clickhouse/clickstack-all-in-one:latest
7 clickstack
Once the container is running, the ClickStack UI will be available at http://localhost:8080. Create a user and log-in.
For a sample dataset, you can modify your local data source to point to our demo server by following steps (1) and (2) in this guide.
To use the MCP server, you will also need a Personal API Access Key. Inside the ClickStack UI, navigate to: Team Settings → Integrations → API Keys → Personal API Access Key.
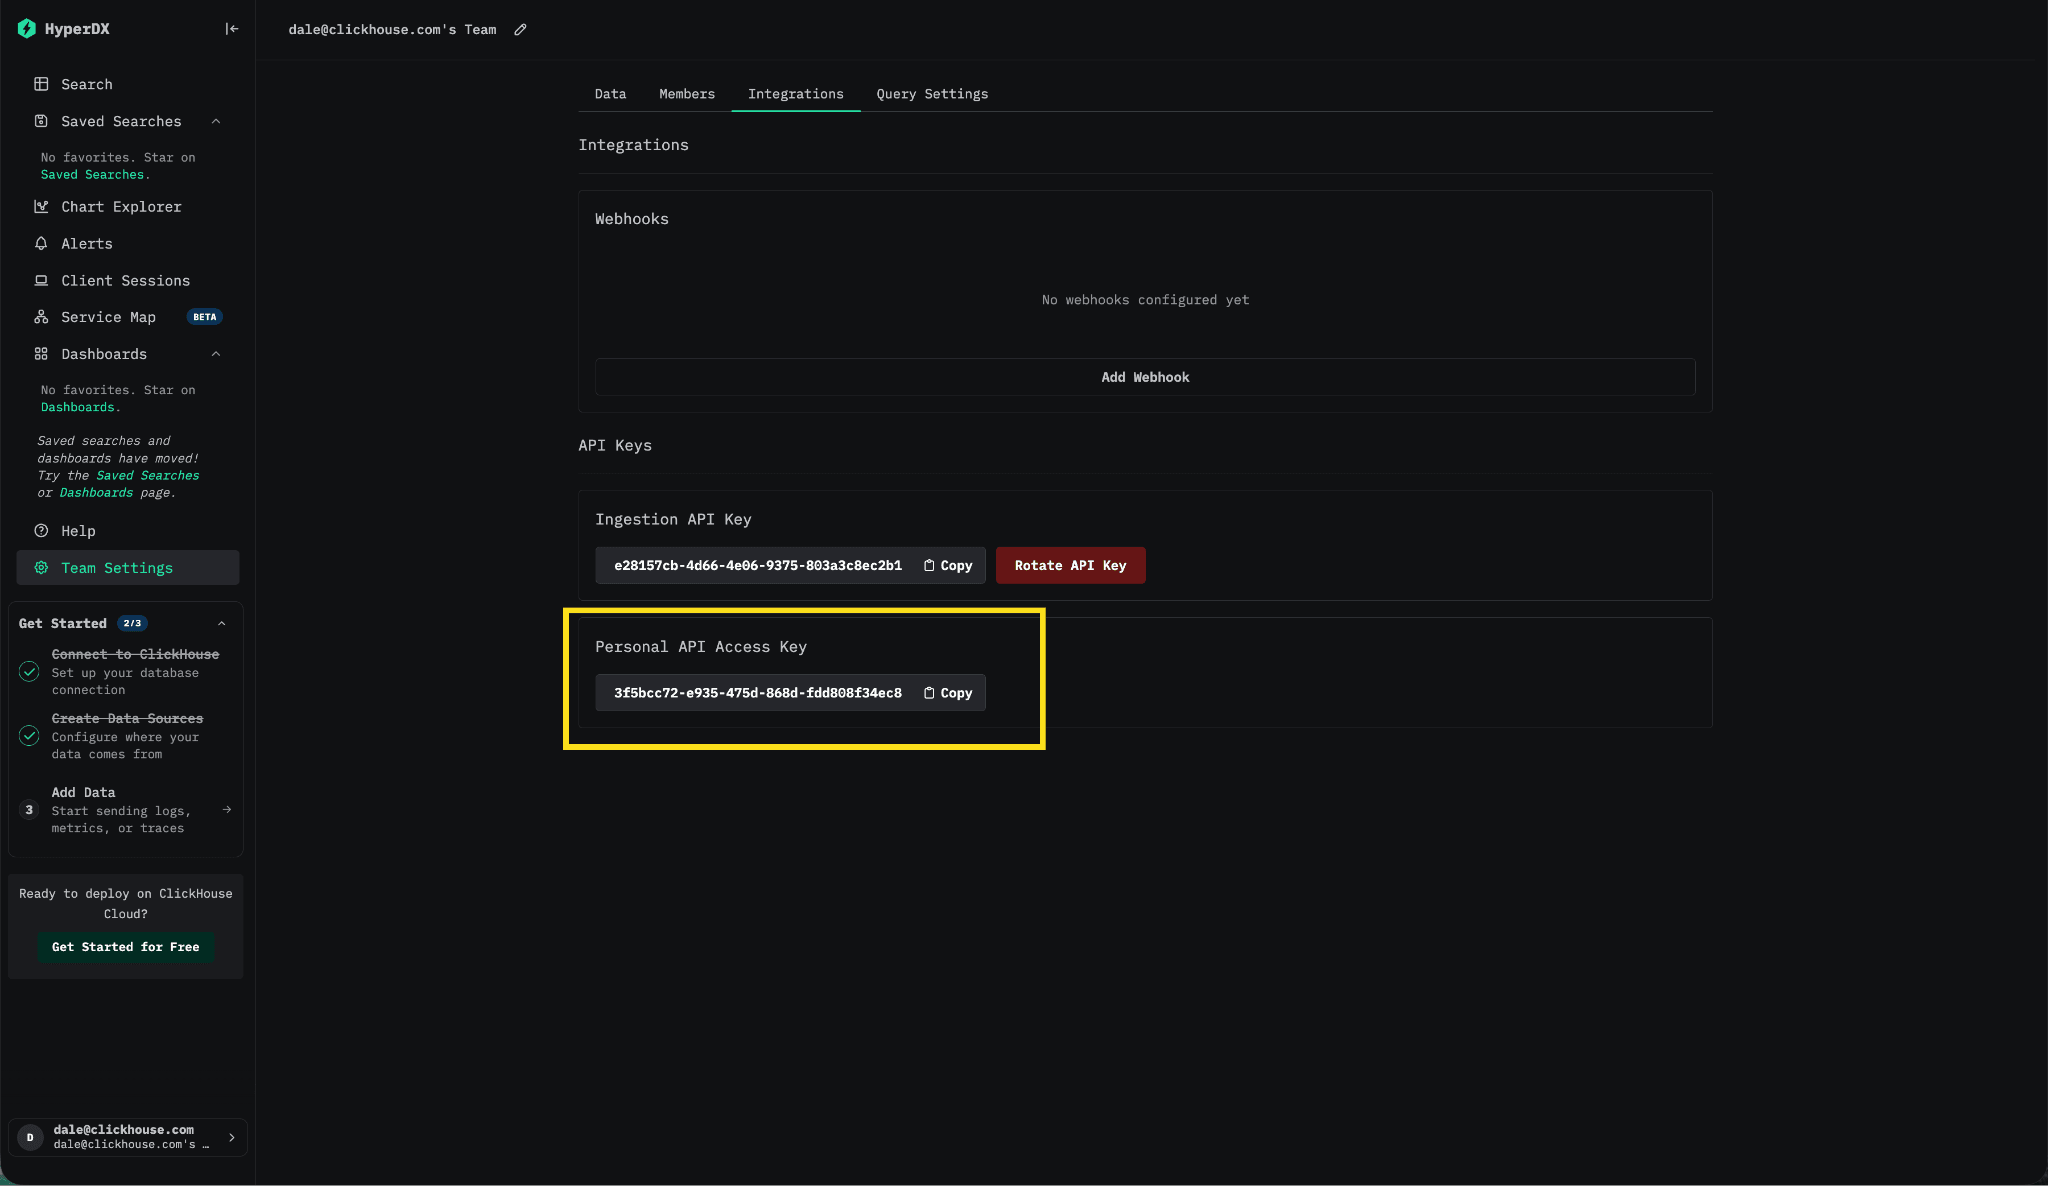
The MCP endpoint is exposed at http://localhost:8080/api/mcp.
From there, you can connect whichever MCP-compatible client or agent framework you already use.
For example, to connect Claude Code:
1claude mcp add --transport http clickstack http://localhost:8080/api/mcp
2 --header "Authorization: Bearer <your-api-key>"
Added HTTP MCP server clickstack with URL: http://localhost:8080/api/mcp to local config Headers: { "Authorization": "Bearer <your-api-key>" } File modified: /Users/demo_user/.claude.json [project: /Users/demo_user]
Once connected, the agent can begin interacting directly with ClickStack’s observability primitives. For example, you can ask questions like:
“Show me the services with the highest error rate over the last hour”
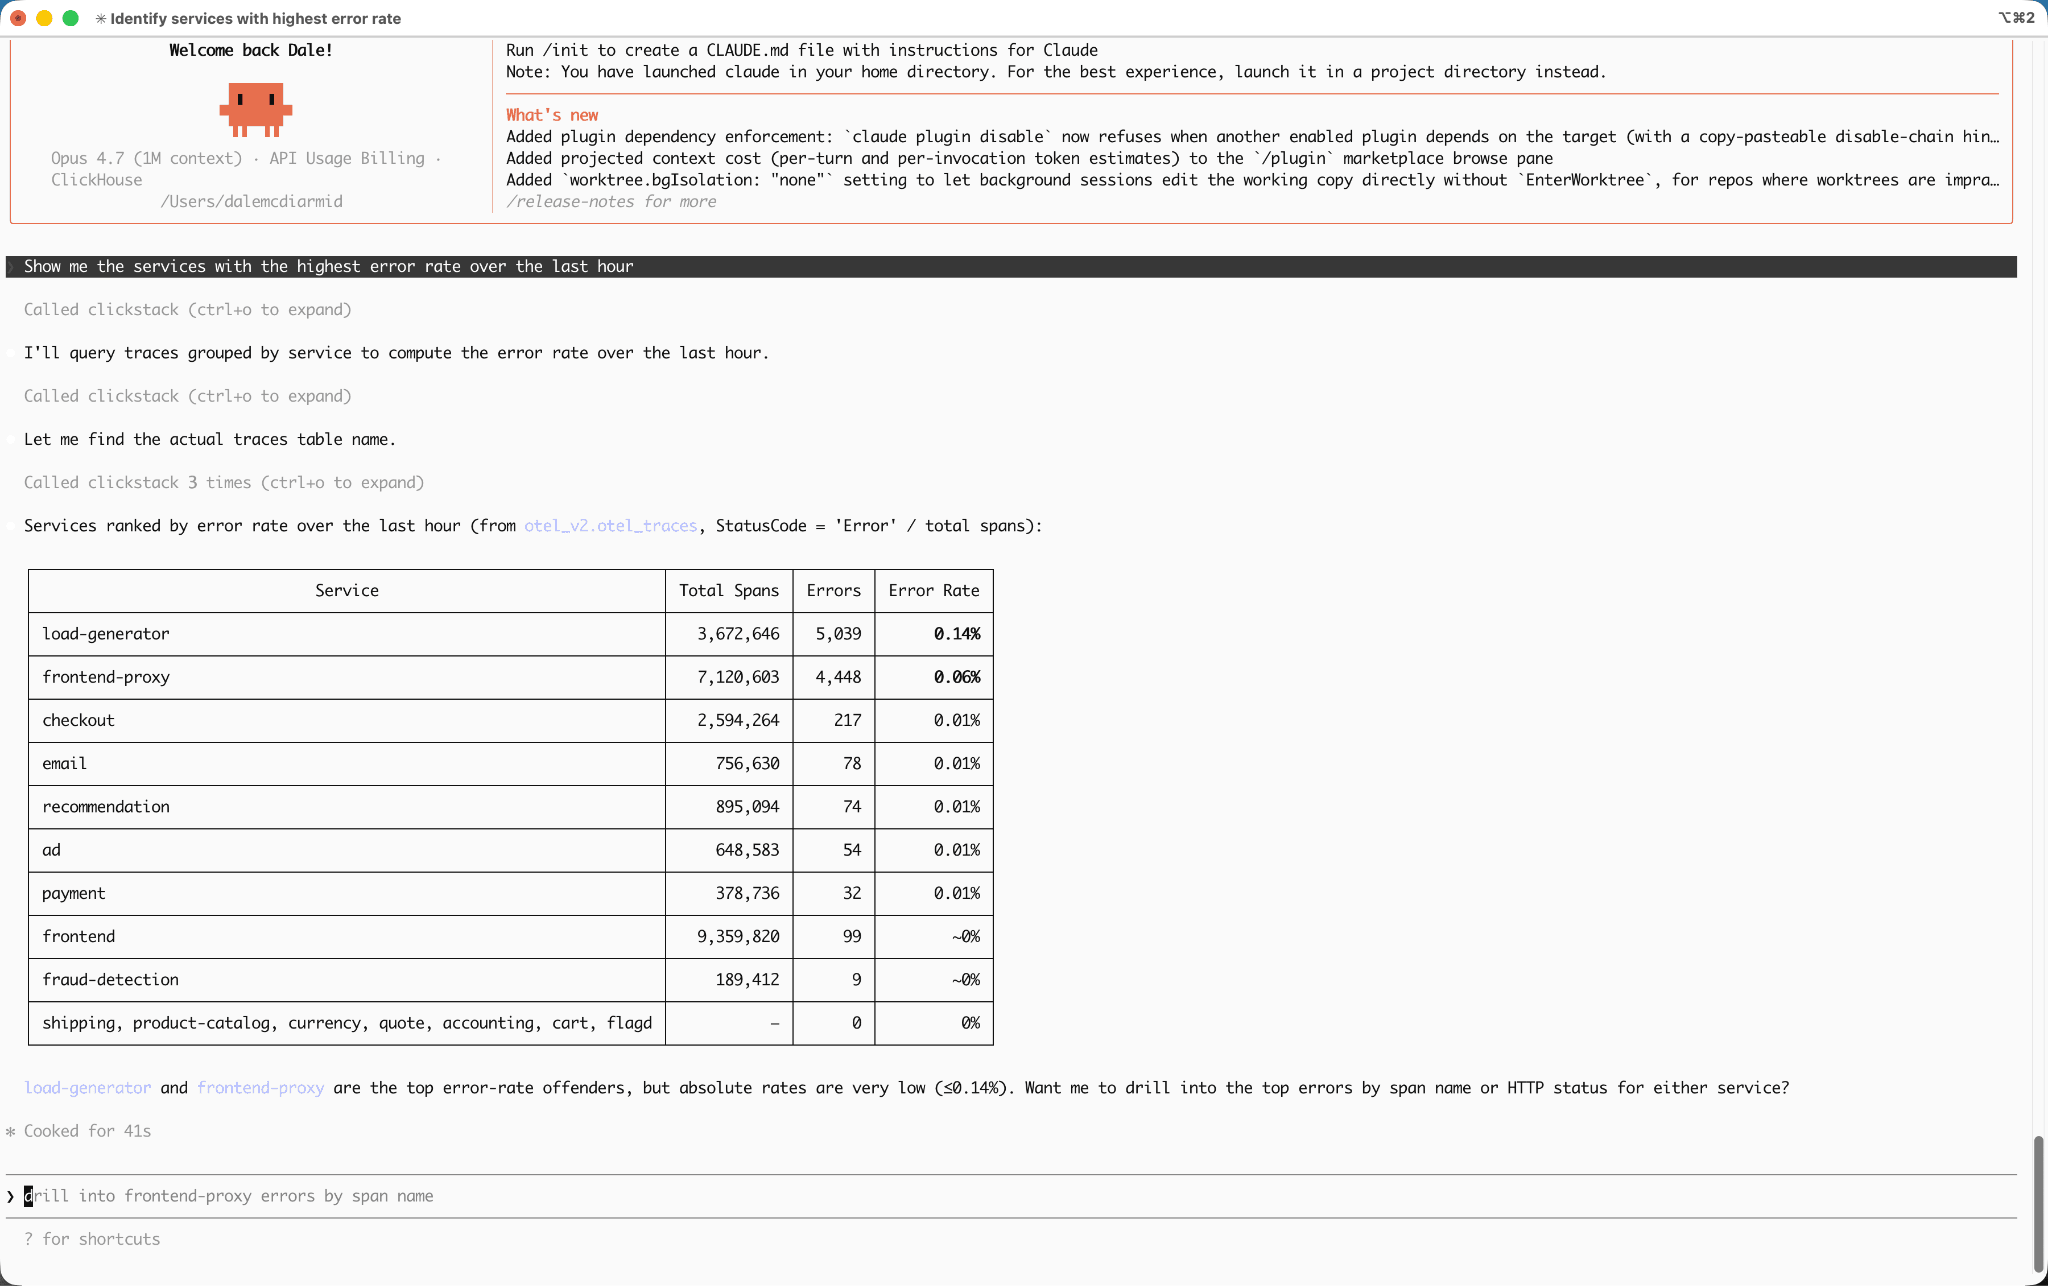
Underneath, the MCP server routes these requests through the same optimized investigative tools used by AI Notebooks rather than relying entirely on ad hoc SQL generation.
Suppose we investigate elevated latency in a payment service and eventually determine, through Claude, that the root cause is a cache eviction issue.
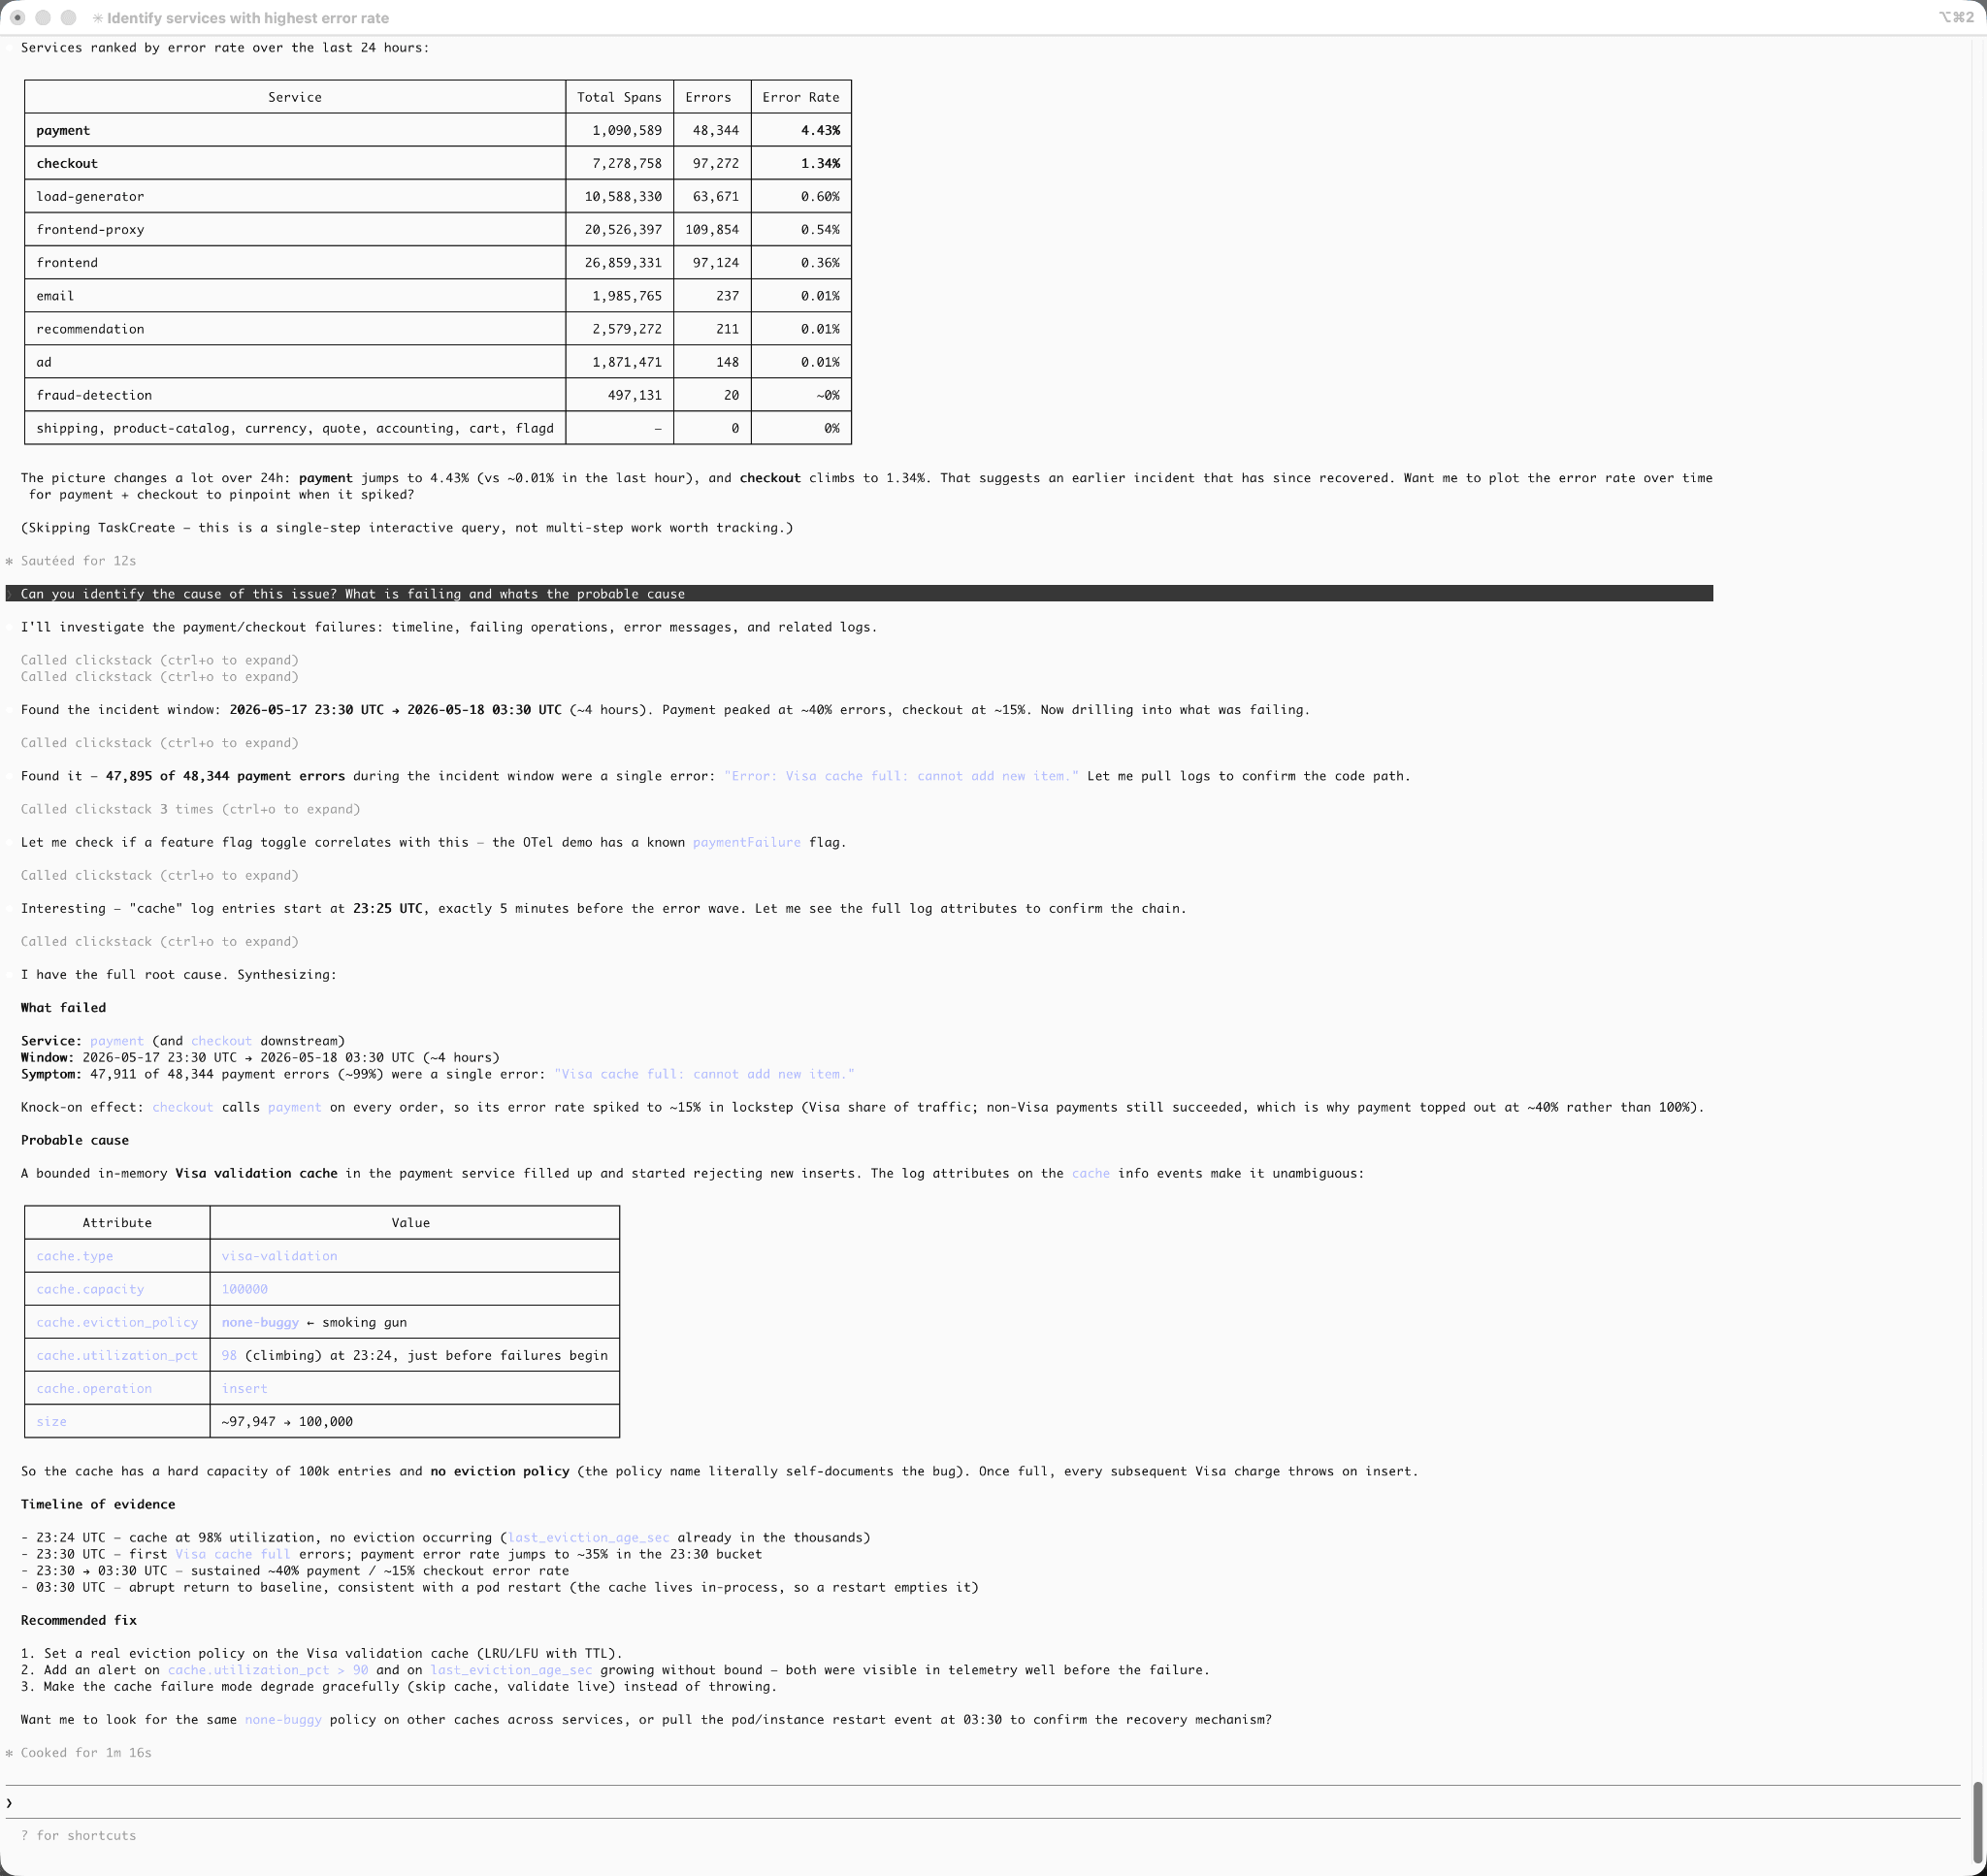
At that point, we need a way to persist and share the investigation. We could copy the raw Claude output into a document or ask the model to generate a static HTML report, but neither workflow feels particularly natural.
Below, we use the MCP server to generate a dashboard summarizing the investigation and to persist the findings directly in ClickStack, with a validation step confirming that the dashboard presents the required evidence.
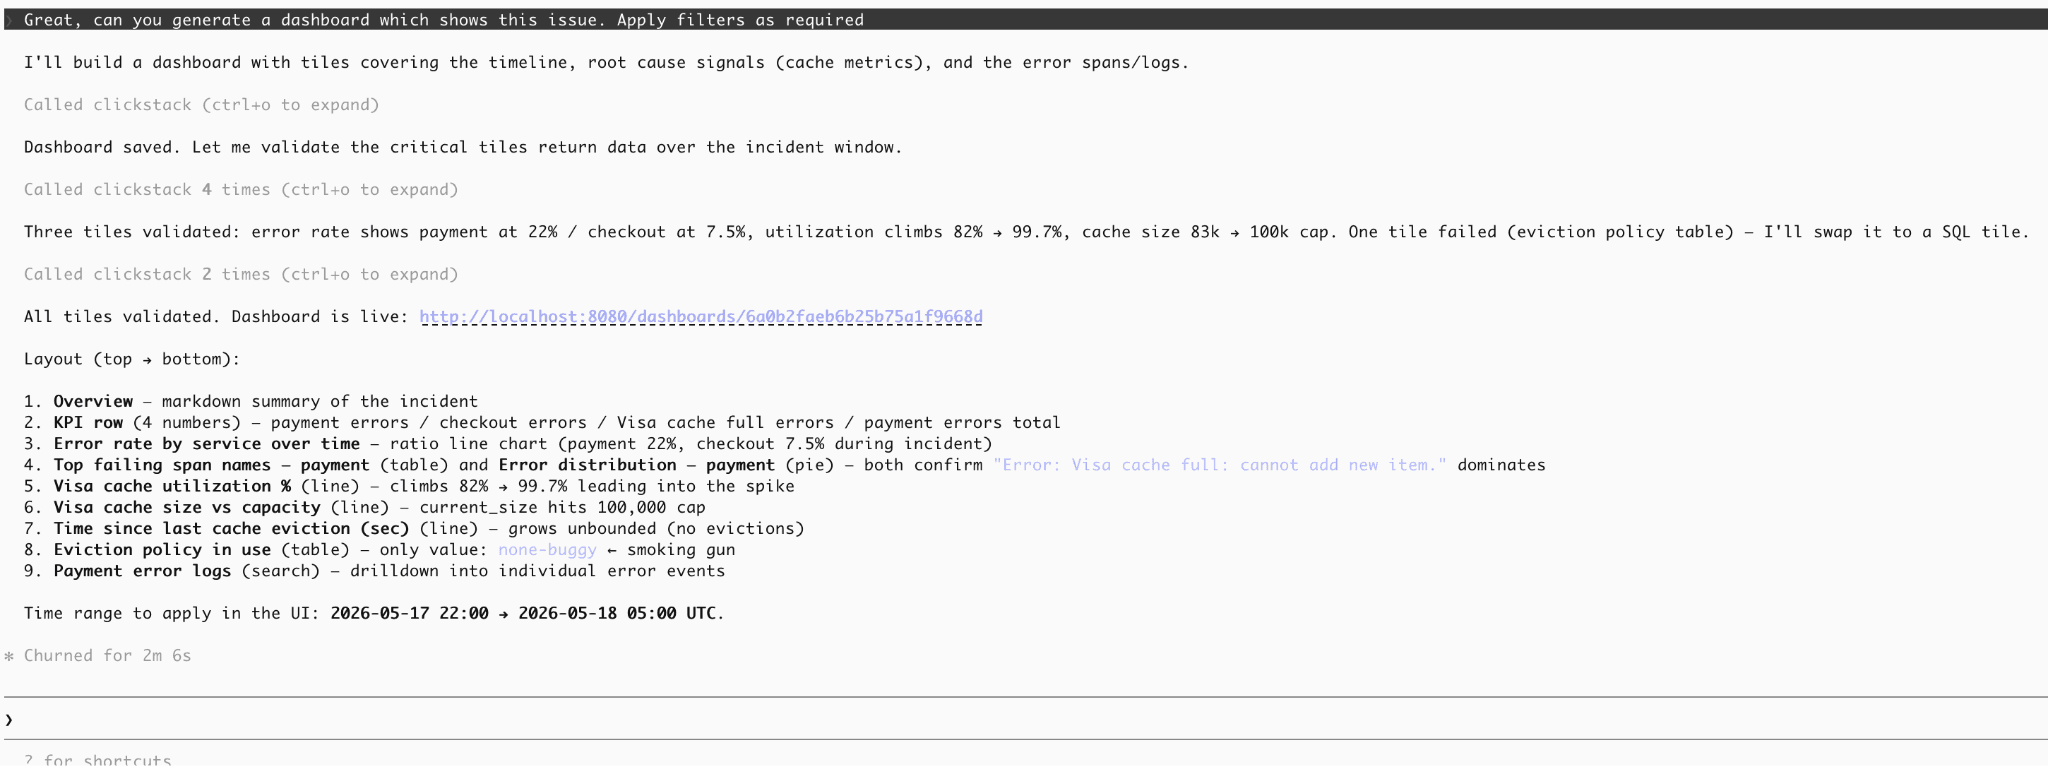
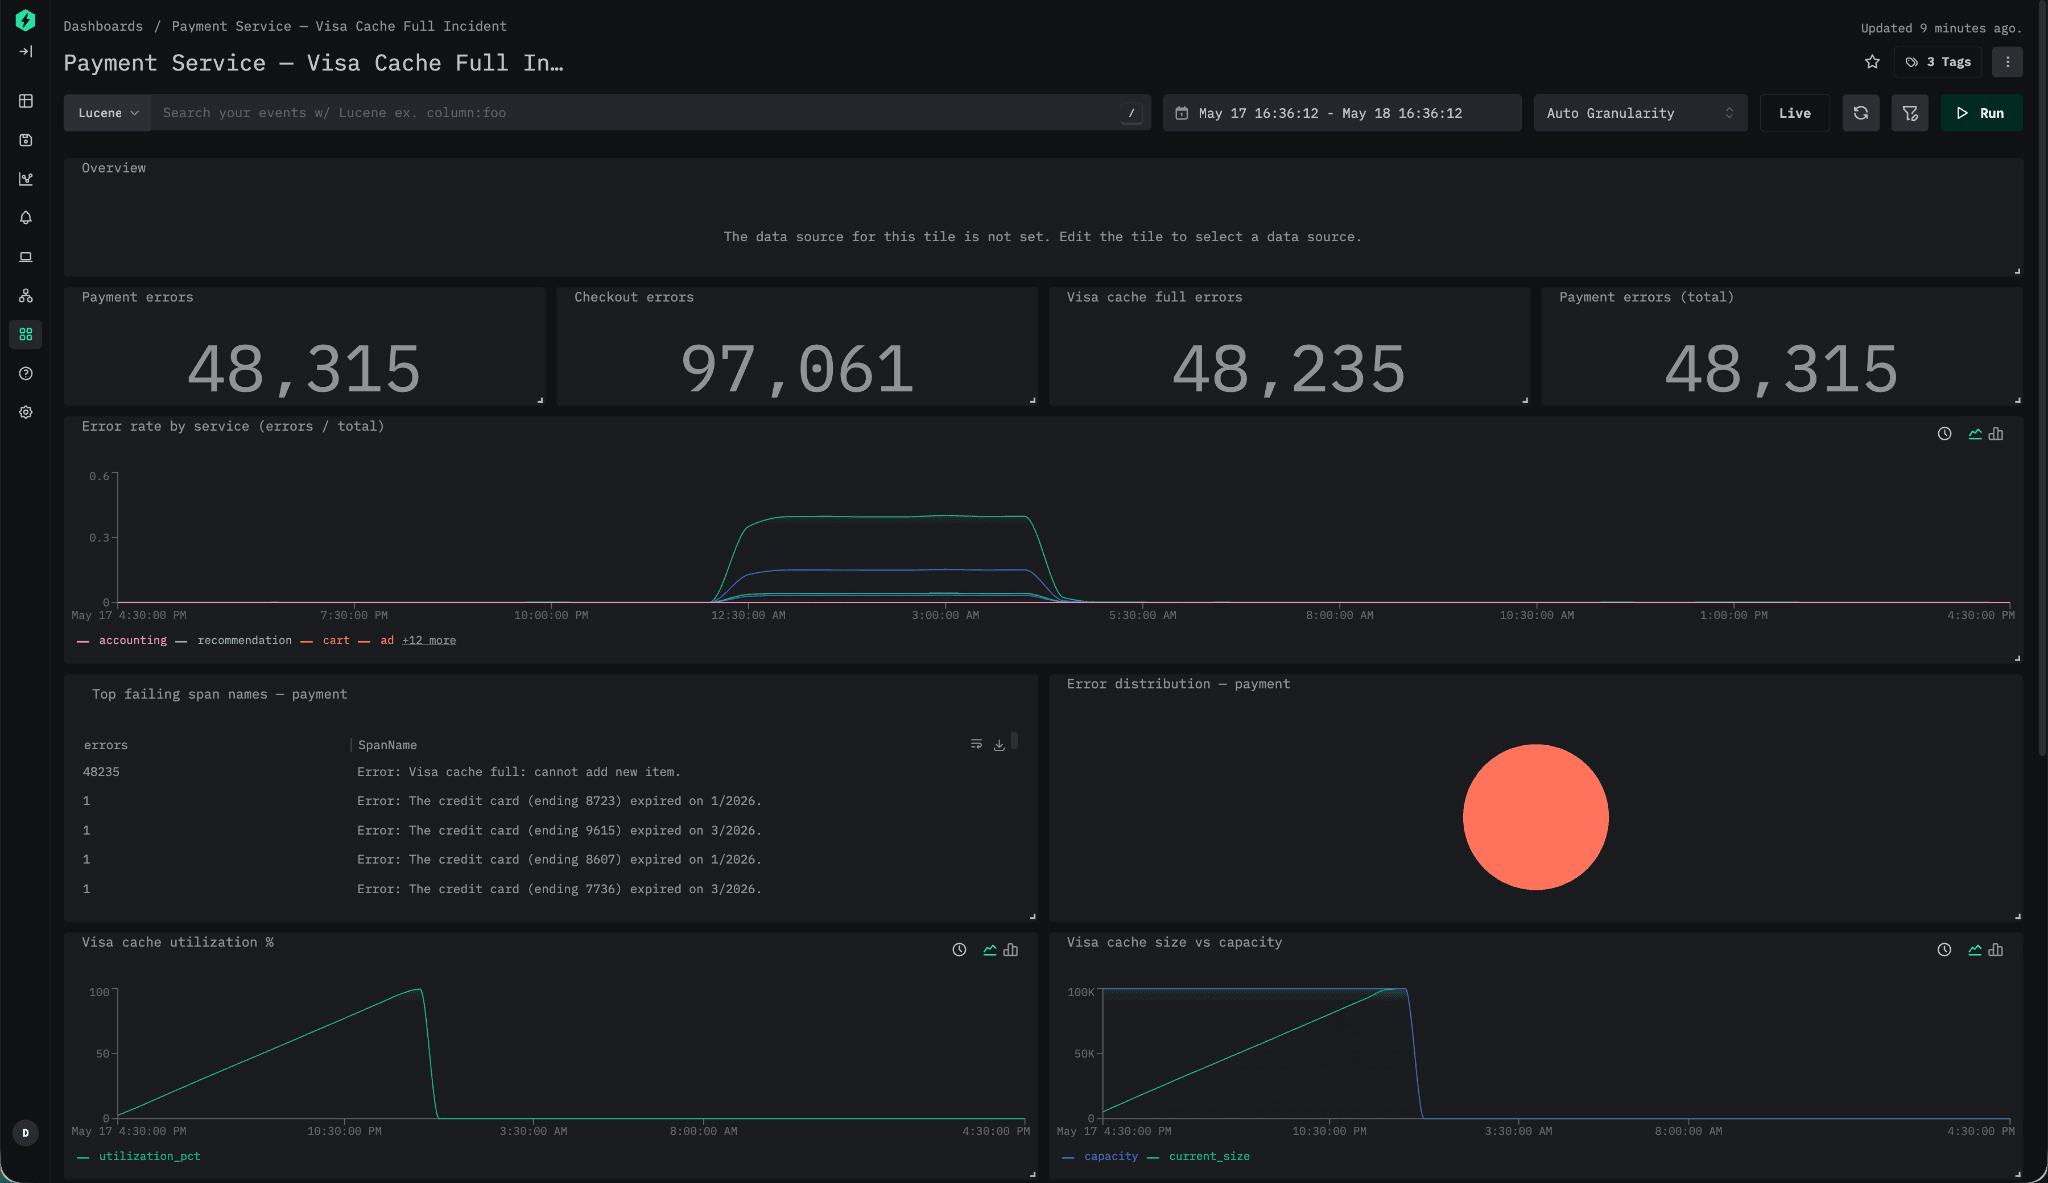
Our resulting dashboard provides a persisted artifact summarizing the incident and presenting evidence for any RCA document.
上手 ClickStack MCP 服务器非常简单。在本地体验完整堆栈的最简单方法是使用 ClickStack 一体式容器,它包含了 ClickHouse、ClickStack UI(HyperDX)、OpenTelemetry 接收端点以及 MCP 服务器。
1docker run --name clickstack
2 -p 8123:8123
3 -p 8080:8080
4 -p 4317:4317
5 -p 4318:4318
6 clickhouse/clickstack-all-in-one:latest
7 clickstack
容器运行后,ClickStack UI 将在 http://localhost:8080 可用。创建一个用户并登录。
要获取示例数据集,你可以按照本指南中的步骤 (1) 和 (2) 修改本地数据源,使其指向我们的演示服务器。
要使用 MCP 服务器,你还需要一个个人 API 访问密钥。在 ClickStack UI 中,导航至:Team Settings → Integrations → API Keys → Personal API Access Key。
MCP 端点为 http://localhost:8080/api/mcp。
在这里,你可以连接任何已有的 MCP 兼容客户端或智能体框架。
例如,要连接 Claude Code:
1claude mcp add --transport http clickstack http://localhost:8080/api/mcp
2 --header "Authorization: Bearer <your-api-key>"
已将 HTTP MCP 服务器 clickstack 及其 URL: http://localhost:8080/api/mcp 添加到本地配置 Headers: { "Authorization": "Bearer <your-api-key>" } 文件已修改: /Users/demo_user/.claude.json [project: /Users/demo_user]
连接完成后,智能体即可直接与 ClickStack 的可观测原语交互。例如,你可以问:
“显示过去一小时内错误率最高的服务”
在底层,MCP 服务器将这些请求路由至 AI Notebooks 所使用的相同优化调查工具,而不是完全依赖即兴的 SQL 生成。
假设我们调查某个支付服务中的延迟升高问题,并最终通过 Claude 确定根因是一个缓存逐出问题。
此时,我们需要一种方法来持久化并分享调查结果。我们可以将 Claude 的原始输出复制到文档中,或要求模型生成一份静态 HTML 报告,但这两种工作流都不够自然。
接下来,我们使用 MCP 服务器生成一个总结调查的仪表盘,并直接在 ClickStack 中持久化发现,同时还有一个验证步骤确认仪表盘呈现了所需的证据。
最终得到的仪表盘提供了一个持久化的产物,总结了该事件,并为任何 RCA 文档提供了证据。
These announcements all reflect the same broader direction: observability tooling should help engineers investigate systems without locking them into predefined workflows. ClickStack Cloud reduces much of the operational burden, AI Notebooks make investigations easier to document and share, and the MCP server lets teams integrate the same capabilities into their own agents and internal tooling. We’re still at the beginning of this shift, but we expect observability systems to become far more collaborative and programmable than the tooling most teams rely on today.
这些发布都指向同一个更广阔的方向:可观测性工具应该帮助工程师调查系统,而不是将他们锁定在预定义的工作流中。ClickStack Cloud 削减了大量运维负担,AI Notebooks 让调查更容易记录和分享,MCP 服务器则允许团队将相同的能力集成到自己的智能体和内部工具中。我们仍处于这一转变的起点,但我们预计可观测性系统将远比今天大多数团队依赖的工具更具协作性和可编程性。